Variation Segmentation Graph for Reading Volume – Market Trend Insights
RJ0500041_28
- Last Update 06/18/2025
- File Size 0.3MB
- # of Slides 2
- File Format PPTX
- Slide Ratio 16:9
- Color
Keywords
- #Content-Based Slides
- #Design-Based Slides
- #Market and Competitor Analysis
- #Graph
- #Industry Trends
- #Competitive Advantage
- #Horizontal Bar
- #Segmented Horizontal Bar
- #16:9
- #horizontal bar chart PowerPoint
- #segmentation graph slide template
- #data comparison chart
- #market trend visualization
- #year-over-year comparison PPT
About the Product
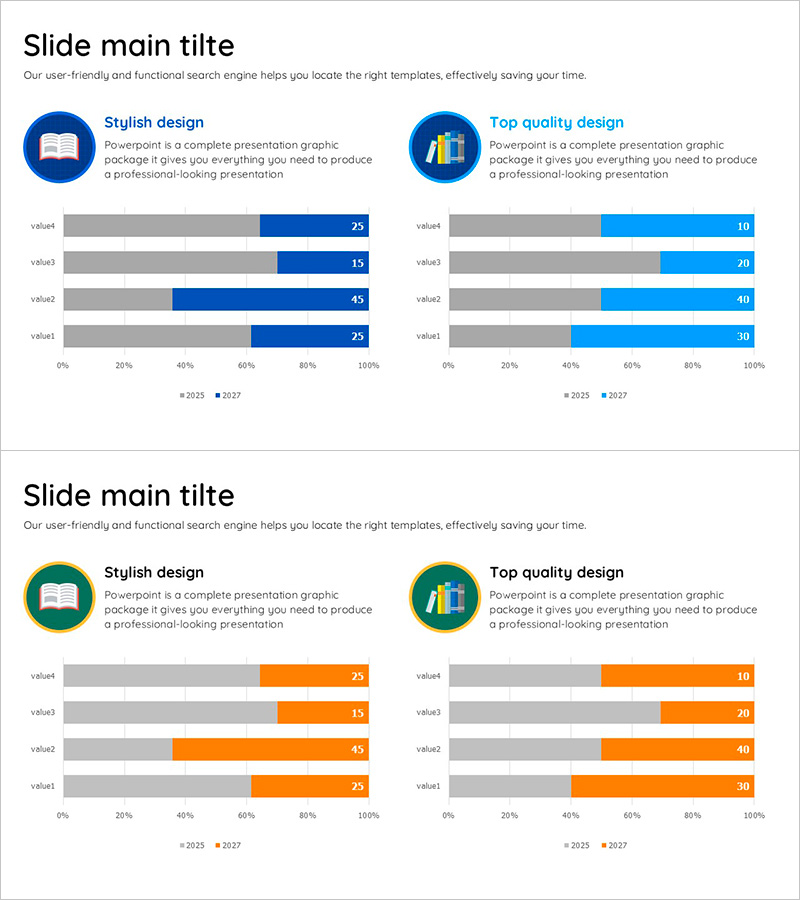
A horizontal segmentation bar chart PowerPoint slide visualizing reading volume changes across four data categories (value1 through value4) comparing 2025 and 2027 figures. This presentation template uses dual-series bars in navy and light blue tones to clearly display year-over-year trends for market analysis and competitive positioning. The slide structure combines descriptive text with icon elements on the left and data visualization on the right, making it ideal for business reports, market insights presentations, and strategic planning documents.
Usage Points
-
Main Usage
Compares numerical data such as reading volume, sales figures, or market share across four categories over two fiscal years. The horizontal bar format enables clear visualization of trend changes and competitive advantages in market analysis presentations.
-
How to Use
Insert into business reports, marketing strategy documents, and investor presentations within market analysis or performance review sections. Data fields are editable, allowing automatic chart updates when figures are modified for rapid presentation preparation.
-
Recommended For
Marketing managers, executives, data analysts, and consultants requiring data-driven decision-making presentations. Particularly effective for quarterly and annual performance comparison briefings and strategic planning sessions.
-
Slide Structure
Two-slide set with each slide divided into left descriptive area (icon, title, text) and right chart area. Four horizontal bar rows with dual series (2025 and 2027), 0–100% scale, standard business chart proportions.
Related Products
-

Touch Wide Slide Template – Segmentation Graph Usage
#Market and Competitor Analysis #Graph #Industry Trends
-

Geometry PPT Template Wide Horizontal Bar Segmentation Graph
#Market and Competitor Analysis #Graph #Industry Trends
-

Comparative Analysis Detailed Bar Graph – Optimal Tool for Competitor Analysis
#Market and Competitor Analysis #Graph #Competitor Analysis
-

Market Research and Trend Segmentation Chart – Effective Market Analysis
#Business Introduction #Market and Competitor Analysis #Graph
