Blue Green Bundled Chart – Visualizing Market Trends
RJ0900003_19
- Last Update 08/16/2025
- File Size 0.1MB
- # of Slides 2
- File Format PPTX
- Slide Ratio 16:9
- Color
Keywords
- #Content-Based Slides
- #Design-Based Slides
- #Market and Competitor Analysis
- #Graph
- #Industry Trends
- #Competitive Advantage
- #Horizontal Bar
- #Grouped Horizontal Bar
- #16:9
- #grouped bar chart PowerPoint
- #horizontal bar graph template
- #market trend slide
- #multi-series comparison chart
- #year-over-year data visualization
About the Product
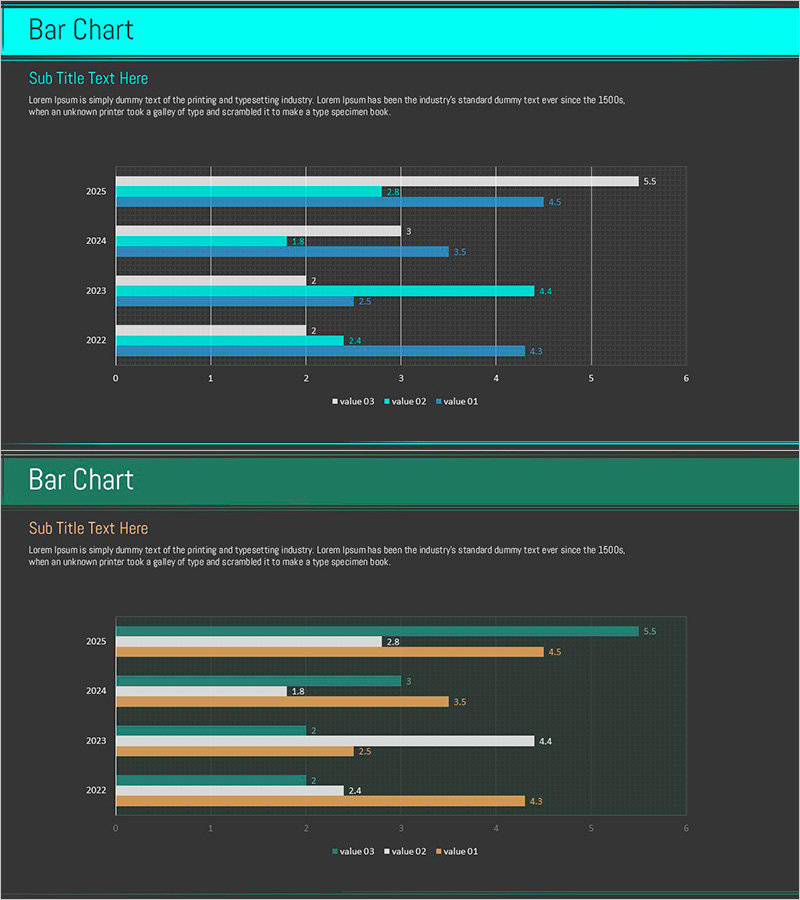
A grouped horizontal bar chart PowerPoint slide comparing market trends across three data series over five years (2022–2025). The design uses cyan and gray tones to clearly differentiate data categories, allowing viewers to instantly grasp year-over-year changes and competitive positioning. Each year displays three values (value 01, 02, 03) side by side, making it ideal for competitive analysis, market share comparison, sales trend visualization, and business performance reporting. Provided as a 2-slide set in 16:9 widescreen format with fully editable text and numerical values.
Usage Points
-
Main Usage
Visualize year-over-year market trends and competitive dynamics by comparing multiple data series simultaneously. The cyan accent against a dark background emphasizes key metrics, while the five-year timeline enables comprehensive trend analysis on a single slide.
-
How to Use
Insert into business reports, marketing plans, or investor presentations within the market analysis section. Replace each bar value with actual data and update the legend labels (value 01, 02, 03) to match your categories. Adjust year labels and axis ranges as needed for your specific dataset.
-
Recommended For
Marketing managers, executives, financial analysts, and consultants who rely on data-driven decision-making. Particularly suited for quarterly or annual performance comparisons, competitive benchmarking, and market size trend analysis in executive presentations.
-
Slide Structure
Two-slide set. First slide features a cyan header with dark background displaying five years of grouped horizontal bars across three data series. Second slide uses a green header variant for tonal flexibility. Both slides include title, subtitle, legend, and data labels for comprehensive information display.
Related Products
-

Travel Horizontal Bar Bundled Graph – Market Trends and Competitive Advantage
#Market and Competitor Analysis #Graph #Industry Trends
-

Competitor Analysis and Market Trends Graph – Contrast of Blue and Red
#Market and Competitor Analysis #Graph #Competitor Analysis
-

Touch Wide Slide Template – Segmentation Graph Usage
#Market and Competitor Analysis #Graph #Industry Trends
-

Comparative Analysis Area Graph – Enhancing Market Competitiveness
#Market and Competitor Analysis #Graph #Other
