Travel Horizontal Bar Bundled Graph – Market Trends and Competitive Advantage
RJ0600080_22
- Last Update 07/11/2025
- File Size 0.2MB
- # of Slides 2
- File Format PPTX
- Slide Ratio 16:9
- Color
Keywords
- #Content-Based Slides
- #Design-Based Slides
- #Market and Competitor Analysis
- #Graph
- #Industry Trends
- #Competitive Advantage
- #Horizontal Bar
- #Grouped Horizontal Bar
- #16:9
- #horizontal bar chart PowerPoint
- #bundled bar graph template
- #market analysis slide
- #competitive analysis chart
- #data comparison PowerPoint slide
About the Product
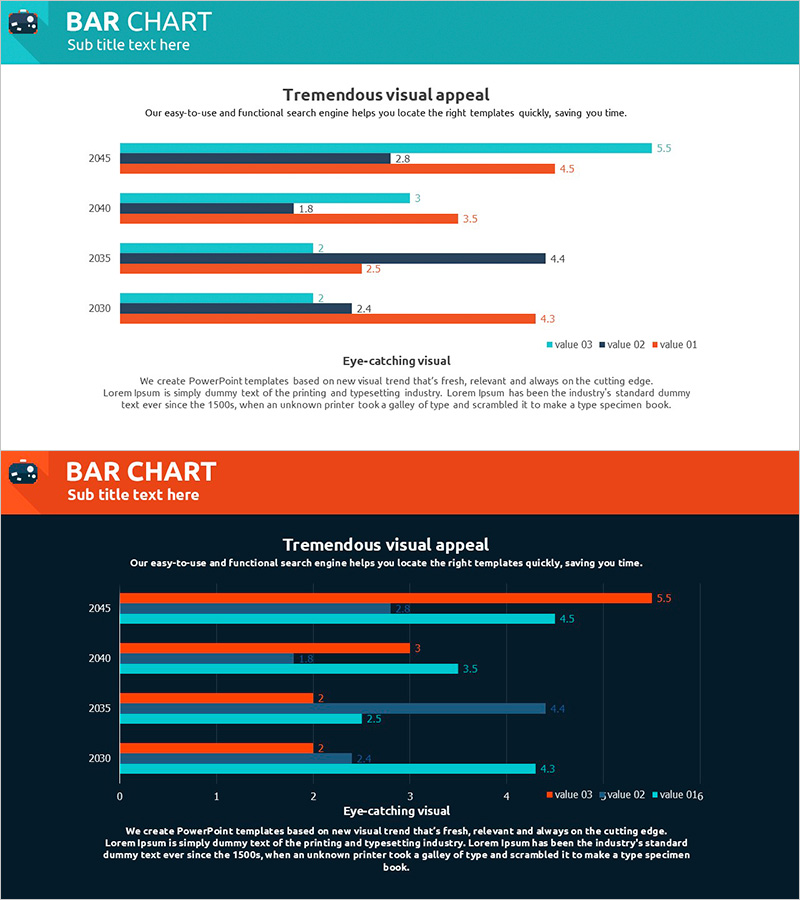
A horizontal bar bundled chart PowerPoint slide designed for travel industry market analysis. This 2-slide set visualizes multi-series data (teal, orange, and dark navy) across years 2030–2045 for competitive benchmarking. Each slide features a header section with title and subtitle, and data labels embedded in the bars for precise value communication. The bundled bar layout enables side-by-side comparison of three metrics within the same time period, making it ideal for business proposals, investor presentations, and quarterly reports. Fully editable—simply update the data to apply this template to any industry analysis.
Usage Points
-
Main Usage
This slide compares multiple data series (market size, growth rate, competitor share) across time periods for the travel, tourism, and hospitality sectors. The bundled bar layout displays three metrics side-by-side for each year, enabling instant visual comparison while data labels provide exact figures.
-
How to Use
Insert this slide into business plans, investor pitch decks, marketing strategy presentations, and quarterly performance reports in the market analysis section. The template auto-adjusts bar lengths and labels when you update the data, making it reusable across industries and time ranges. Customize colors to match your brand identity.
-
Recommended For
Executives, marketing teams, strategic planners, and sales professionals presenting market conditions and competitive advantages. Particularly effective for travel, tourism, hospitality, aviation, and transportation sectors when proposing new business initiatives or reporting performance outcomes.
-
Slide Structure
2-slide set. Each slide divides into a teal header (title and subtitle area) and white content area. The horizontal bar chart displays years (2030, 2035, 2040, 2045) on the Y-axis and numeric scale on the X-axis. Three data series (teal, orange, navy bars) are grouped by year, with numeric labels at the bar ends. Legend positioned in the upper right corner.
Related Products
-

Blue Green Bundled Chart – Visualizing Market Trends
#Market and Competitor Analysis #Graph #Industry Trends
-

Sophisticated Vertical Bar Chart – Market Trend Analysis
#Market and Competitor Analysis #Graph #Industry Trends
-

Bundled Horizontal Bar Graph for Market Trend Analysis – A New Perspective on Data
#Market and Competitor Analysis #Graph #Market Status
-

Horizontal Bar Chart for Construction Project Performance Analysis – Stability and Growth
#Market and Competitor Analysis #Diagram #Graph
