Touch Wide Slide Template – Segmentation Graph Usage
RJ0200008_22
- Last Update 03/30/2025
- File Size 3.3MB
- # of Slides 2
- File Format PPTX
- Slide Ratio 16:9
- Color
Keywords
- #Content-Based Slides
- #Design-Based Slides
- #Market and Competitor Analysis
- #Graph
- #Industry Trends
- #Competitive Advantage
- #Horizontal Bar
- #Segmented Horizontal Bar
- #16:9
- #100% stacked bar chart
- #horizontal bar graph PowerPoint
- #4-series data visualization
- #market analysis slide
- #competitive advantage chart
- #ratio comparison template
About the Product
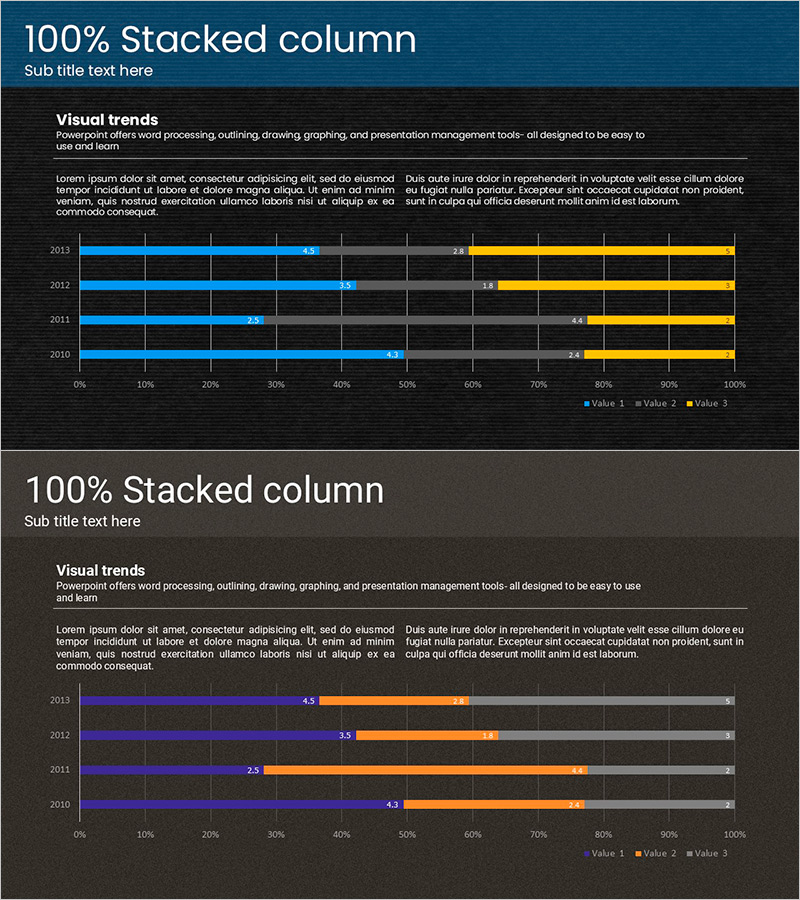
A 100% stacked horizontal bar chart PowerPoint slide optimized for market trend analysis and competitive positioning. This 2-slide set visualizes 4 data series across multiple years, with each series color-coded for clear ratio comparison. The dark background features blue, yellow, orange, and gray color schemes that enhance data readability, while numeric labels provide precise information. Delivered in 16:9 widescreen PPTX format for immediate editing and presentation use.
Usage Points
-
Main Usage
Compare ratio changes across 4+ categories (market share, revenue composition, customer segments) over multiple years. The 100% stacked structure clearly visualizes each series' proportion relative to the whole, making it ideal for highlighting competitive advantages and market shifts.
-
How to Use
Double-click the chart data to edit values and the graph updates automatically. Modify year labels (2010–2013) and series names (Value 1–3) as needed. Customize colors to match your corporate brand by right-clicking the chart elements and selecting formatting options.
-
Recommended For
Marketing plans, business reports, investor pitch decks, and market analysis presentations. Recommended for executives, marketing teams, strategy planners, and sales professionals presenting market trends and competitive positioning.
-
Slide Structure
2-slide set with the first slide featuring a 2-series (blue and yellow) 100% stacked horizontal bar chart, and the second slide showing a 4-series (blue, yellow, orange, gray) version. Each slide includes title, subtitle, and description text areas, with a 0–100% horizontal axis and year-based row labels.
Related Products
-

Variation Segmentation Graph for Reading Volume – Market Trend Insights
#Market and Competitor Analysis #Graph #Industry Trends
-

Geometry PPT Template Wide Horizontal Bar Segmentation Graph
#Market and Competitor Analysis #Graph #Industry Trends
-

Analysis of Changes in Transportation Vehicles Using Horizontal Bar Chart
#Market and Competitor Analysis #Graph #Industry Trends
-

Comparative Analysis Area Graph – Enhancing Market Competitiveness
#Market and Competitor Analysis #Graph #Other
