Visualizing Market Overview with Donut Chart - Business Strategy
RJ0600083_15
- Last Update 07/12/2025
- File Size 2MB
- # of Slides 2
- File Format PPTX
- Slide Ratio 16:9
- Color
Keywords
About the Product
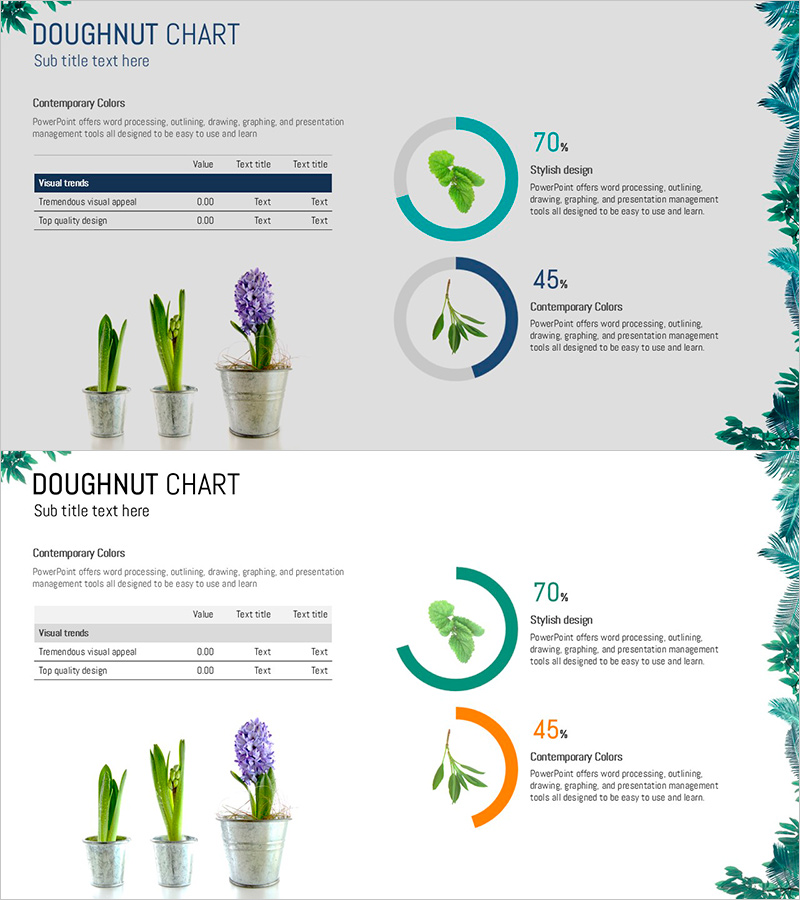
A two-slide PowerPoint presentation template for market overview and competitive analysis using donut charts. The first slide combines a data table with a single donut chart, while the second slide features two donut charts side-by-side for comparative visualization. Turquoise, navy, and orange donut segments clearly represent data percentages, with plant imagery and text areas on the left creating visual balance. This slide deck is ideal for business strategy presentations where you need to communicate market conditions, customer preferences, and performance metrics with clarity and impact.
Usage Points
-
Main Usage
Visualize market conditions, customer preferences, and performance metrics using donut charts to provide clear decision-making insights during business strategy presentations. The combination of tables and charts delivers both quantitative data and visual insights simultaneously.
-
How to Use
Use the first slide in market analysis sections to introduce key indicators; use the second slide to compare two metrics such as competitive positioning, customer satisfaction, or market share. Simply edit the donut chart percentages and text fields to input your actual data.
-
Recommended For
Business planners, marketing managers, and sales professionals presenting market analysis results to executives, investors, and partners. Particularly effective when communicating ratio-based data such as market share, customer segmentation, product preferences, or achievement rates.
-
Slide Structure
Two-slide layout with the first slide containing title, descriptive text, three-row data table, one donut chart (70% emphasis), and explanation text area. The second slide features title, descriptive text, two donut charts (70% and 45% ratios), and individual explanation text areas for each chart.
Related Products
-

Climbing Silhouette Bent Line Graph – Market Analysis and Performance
#Business Strategy #Market and Competitor Analysis #Graph
-

Donut Chart Visualization of Performance – Business Strategy
#Business Strategy #Market and Competitor Analysis #Graph
-

Annual Momentum Record – Visualization of Achievements
#Business Strategy #Market and Competitor Analysis #Graph
-

Analysis of Climbing Success Rate with Doughnut Chart
#Business Strategy #Market and Competitor Analysis #Graph
