Climbing Silhouette Bent Line Graph – Market Analysis and Performance
RJ0600090_28
- Last Update 07/15/2025
- File Size 1.8MB
- # of Slides 2
- File Format PPTX
- Slide Ratio 16:9
- Color
Keywords
- #Content-Based Slides
- #Design-Based Slides
- #Business Strategy
- #Market and Competitor Analysis
- #Graph
- #Other
- #Achievements
- #Market Overview
- #16:9
- #roadmap timeline PowerPoint slide
- #3-year business plan PPT
- #line graph presentation template
- #performance analysis slides
- #how to create a roadmap in PowerPoint
About the Product
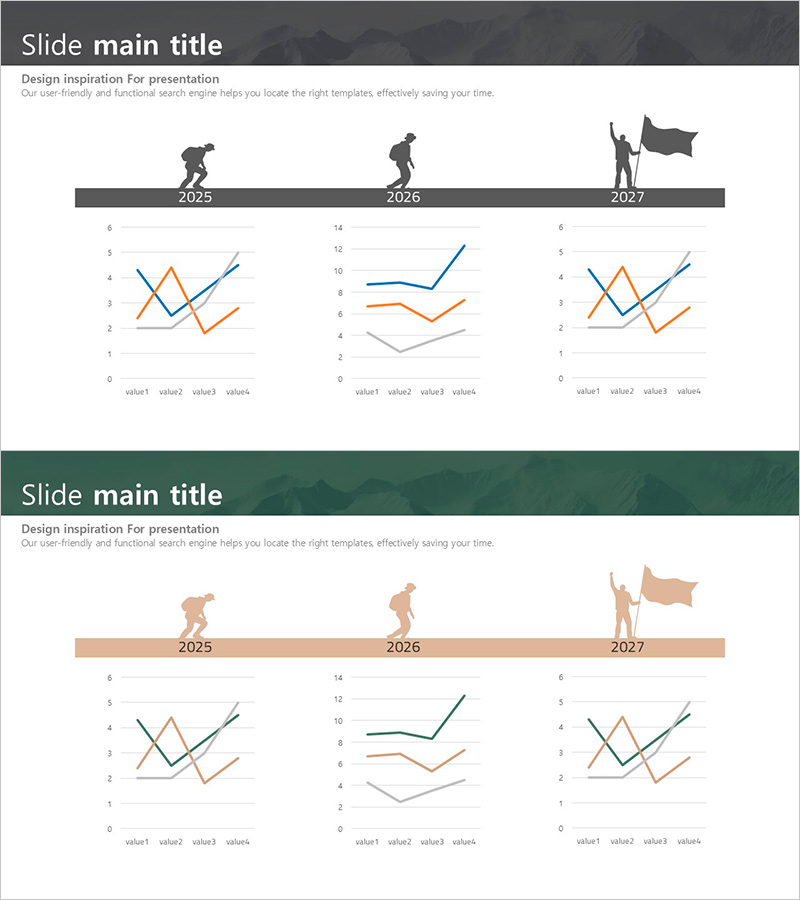
A professional PowerPoint slide visualizing business performance and market trends from 2025 to 2027. This presentation template features climbing silhouette icons marking each year's milestone, with multi-line graphs below displaying quantitative data comparison across three years. The dark gray background combined with blue, orange, and gray line colors creates a trustworthy visual for investor presentations, business reports, and strategic planning sessions. The 16:9 widescreen format includes 2 fully editable slides ready for immediate use.
Usage Points
-
Main Usage
Simultaneously present annual business progress and quantitative performance metrics to investors, employees, and partners with clear visual impact. The timeline structure reinforces credibility of future plans, while multiple data lines demonstrate competitive advantages and measurable achievements across key performance indicators.
-
How to Use
Enter years and milestones on the timeline at the top, then input actual performance data into the graph area below. Customize line colors and legends to compare multiple metrics such as revenue, customer count, or market share. Adjust background colors and icons to match your corporate brand identity and presentation theme.
-
Recommended For
Ideal for business reports, investor pitch decks, quarterly and annual performance reviews, marketing strategy presentations, and executive briefings. Particularly valuable for startups, new business managers, strategic planning teams, and financial analysts presenting multi-year business initiatives and growth projections.
-
Slide Structure
The slide contains one title area, three timeline segments (2025, 2026, 2027), and three corresponding line graphs for each year. Total of four text input areas (title, subtitle, legend) and three data input zones for graph datasets. The comparative layout enables intuitive understanding of performance trends and year-over-year changes across all metrics.
Related Products
-

Financial Performance and Forecast – Diagram for Business Strategy
#Business Strategy #Financial Plans and Performance #Diagram
-

Energy Saving Practice Rate Analysis by Country – Horizontal Bar Chart
#Market and Competitor Analysis #Corporate Social Responsibility #Graph
-

Modern Business Presentation Template Doughnut Chart1 – Visualizing Performance and Strategy
#Business Strategy #Risk Management and Regulatory Compliance #Graph
-

Analysis of Climbing Success Rate with Doughnut Chart
#Business Strategy #Market and Competitor Analysis #Graph
