Red Black Curved Line Trend – Market Analysis and Competitive Advantage
RJ0800045_25
- Last Update 08/13/2025
- File Size 0.5MB
- # of Slides 2
- File Format PPTX
- Slide Ratio 16:9
- Color
Keywords
- #Content-Based Slides
- #Design-Based Slides
- #Business Strategy
- #Market and Competitor Analysis
- #Graph
- #Achievements
- #Competitive Advantage
- #Line
- #Line Chart
- #16:9
- #line chart PowerPoint
- #trend analysis presentation
- #market analysis slide template
- #multi-series line graph
- #how to create line chart in PowerPoint
About the Product
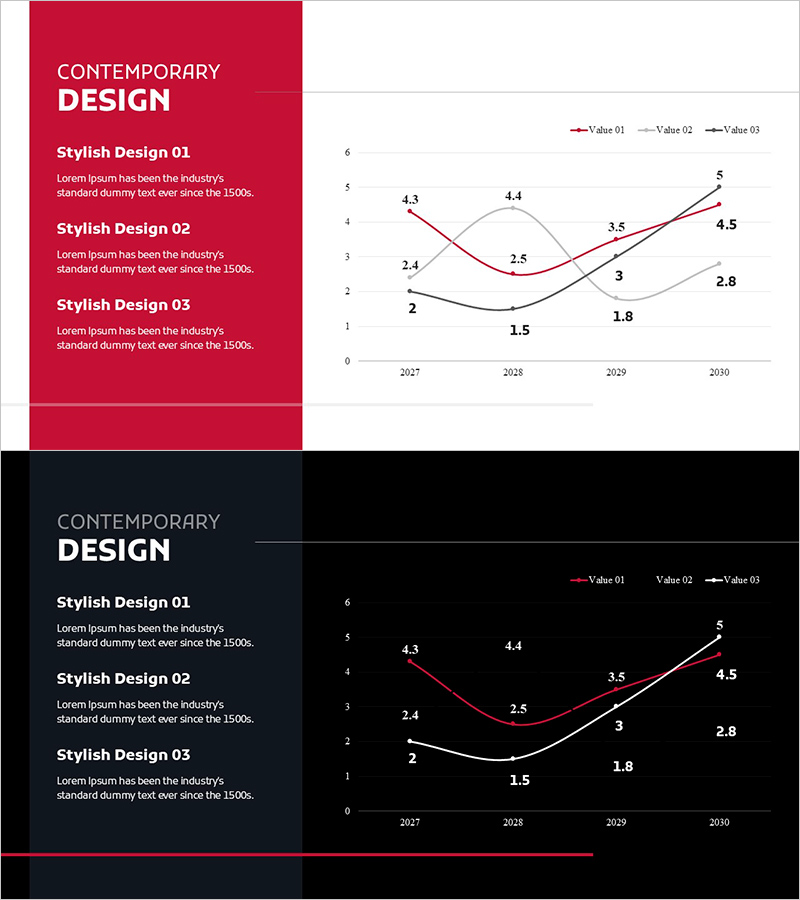
A multi-series line chart PowerPoint slide designed for market analysis and competitive advantage visualization. The curved line graph features three data series in red, black, and gray, tracking changes from 2027 to 2030 across four years. The left panel with red background contains three design style descriptions in text format, while the right chart area uses clean grid lines and labeled data points for clear numerical comparison. This presentation template is ready to use in business reports, proposals, and strategic presentations for performance trends, market dynamics, and competitive positioning sections.
Usage Points
-
Main Usage
Visualize numerical changes over time across three data series for market analysis, competitive positioning, and performance trends. Effectively communicate key metrics and comparative analysis in executive reports, investment proposals, and marketing strategy presentations.
-
How to Use
Replace the text descriptions in the left red panel with your analysis items and explanations. Update the chart data points and series labels (Value 01, 02, 03) with your actual figures. Modify the legend to reflect your specific metrics and adjust colors as needed before inserting into your presentation.
-
Recommended For
Executives, marketing managers, strategy planners, financial analysts, and consultants. Ideal for business performance reporting, market trend analysis, competitor comparison, financial metrics tracking, customer satisfaction trends, and any presentation requiring multi-metric trend comparison.
-
Slide Structure
2-slide set. Slide 1: Red background with left text panel (3 content items) and right line chart (3 series, 4-year timeline, Y-axis 0–6, X-axis 2027–2030). Slide 2: Dark navy background with identical layout. Each series uses distinct line colors with labeled data points showing numerical values.
Related Products
-

American Football Match Performance Status – Highlighting Competitive Advantage
#Business Strategy #Market and Competitor Analysis #Graph
-

Functional Cosmetics Market Size Graph – Growth and Opportunities
#Business Strategy #Market and Competitor Analysis #Graph
-

Graph for Economic Growth and Competitive Advantage Visualization
#Business Strategy #Market and Competitor Analysis #Graph
-

Trends in the Number of Professional Tennis Spectators – Performance and Competitive Advantage
#Business Strategy #Market and Competitor Analysis #Graph
