Weather Area Chart – Market Trend Analysis
RJ0600083_12
- Last Update 07/12/2025
- File Size 0.5MB
- # of Slides 2
- File Format PPTX
- Slide Ratio 16:9
- Color
Keywords
About the Product
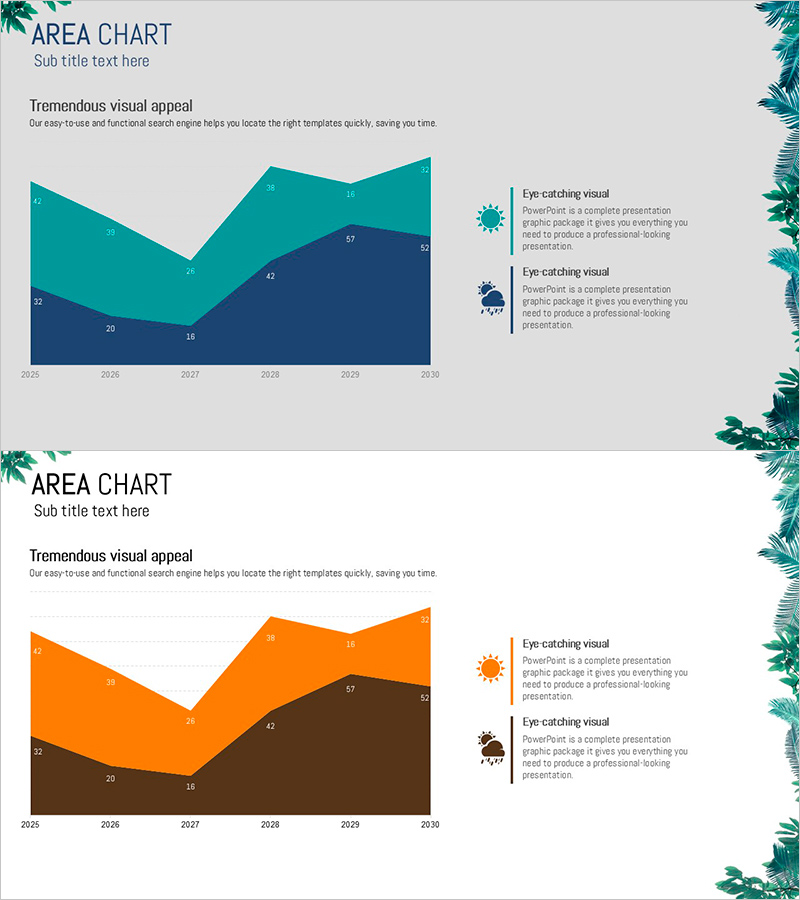
A two-layer area chart PowerPoint slide optimized for market trend analysis and competitive positioning. This presentation slide visualizes time-series data from 2025 to 2030 with contrasting teal and orange areas, making comparative trends immediately clear. Numerical labels within each area ensure precise data communication, while the right-side legend and icons distinctly categorize data layers. The slide is ready to use in business reports, marketing plans, investor presentations, and strategic analysis decks.
Usage Points
-
Main Usage
Compares time-series data across two categories such as market conditions, competitor analysis, or market share evolution. The area contrast effectively communicates both trend changes and relative scale, making it ideal for presenting decision-making evidence.
-
How to Use
Place this slide in the market analysis section of presentations, performance analysis pages of business reports, or market overview sections of marketing plans. Replace values and legend text with your data, adjust colors to match brand guidelines, and present immediately.
-
Recommended For
Executives, marketing managers, business strategists, and financial analysts presenting market data persuasively. Particularly suited for competitive advantage analysis, market share trend comparisons, and revenue growth presentations.
-
Slide Structure
Includes title area, subtitle text, two-layer area chart spanning 2025–2030 (five-year data), two-item legend on the right, and two supporting icons. Numerical labels within chart areas enable accurate data reading and interpretation.
Related Products
-

Partial Highlight Area Graph – Market Trends and Competitive Advantage
#Market and Competitor Analysis #Graph #Other
-

Comparative Analysis Area Graph – Enhancing Market Competitiveness
#Market and Competitor Analysis #Graph #Other
-

Illustration Glass Bottle Segmentation Graph – Market Trend Analysis
#Market and Competitor Analysis #Graph #Other
-

Five Color Powerpoint Template Wide – Charts and Mockups
#Market and Competitor Analysis #Graph #Other
