Illustration Glass Bottle Segmentation Graph – Market Trend Analysis
RJ0900016_16
- Last Update 08/20/2025
- File Size 0.1MB
- # of Slides 2
- File Format PPTX
- Slide Ratio 16:9
- Color
Keywords
About the Product
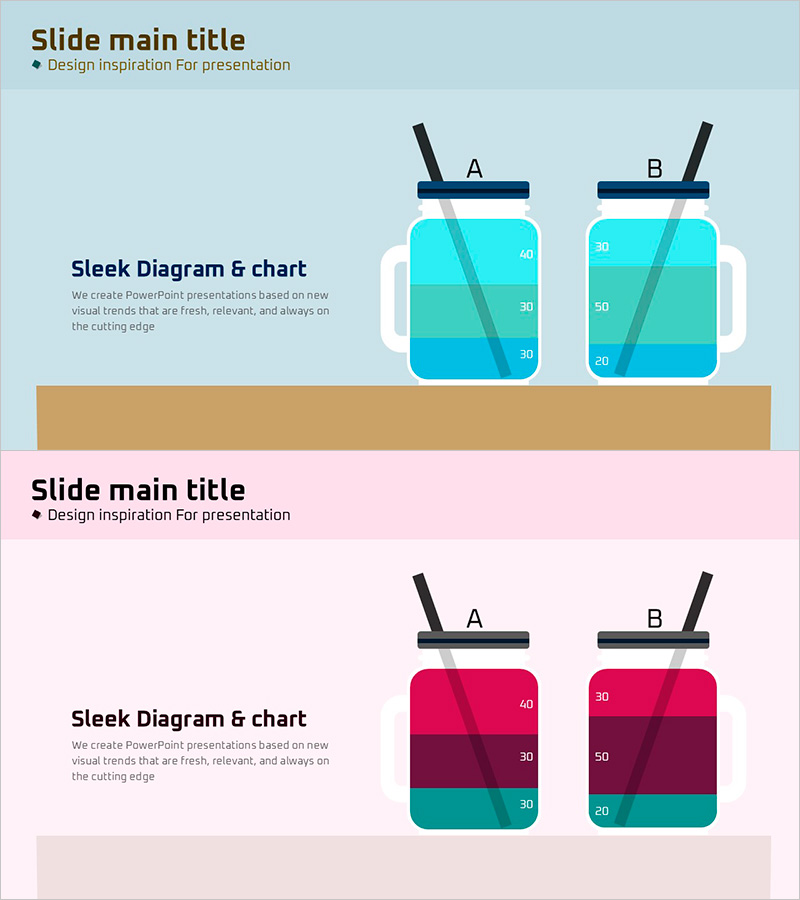
An essential PowerPoint slide for market analysis and competitive positioning strategy. This segmentation chart features a dual-tone background in cyan and pink with two glass bottle-shaped charts positioned side-by-side for easy comparative analysis. Each chart is divided into four segments to visualize numerical data intuitively, while the left text area accommodates detailed analytical descriptions. This two-slide set is ready for immediate use in presentations and reports, applicable to market trends, customer segmentation, product positioning, and various analytical contexts.
Usage Points
-
Main Usage
Visualize customer segmentation, product positioning, and market share comparisons during market analysis and competitive strategy development. The dual-chart structure effectively communicates scenario A vs. B comparisons, current vs. future states, and competitor benchmarking.
-
How to Use
Enter analysis title and description in the left text area, then input numerical data into each chart segment on the right. Chart colors and values are fully editable; data labels can be added or removed based on presentation needs. Arrange both slides sequentially to represent temporal changes or alternative comparisons.
-
Recommended For
Ideal for marketing plans, business proposals, investor pitch decks, and market analysis reports where customer segmentation strategy, product positioning, and market trend analysis are discussed. Supports data-driven decision-making in executive, investor, and partner presentations.
-
Slide Structure
Each slide comprises a left text area (title and two-line description) and a right chart area with two glass bottle-shaped charts. Each chart is divided into four segments representing up to four data categories, with clearly marked numerical input fields.
Related Products
-

Partial Highlight Area Graph – Market Trends and Competitive Advantage
#Market and Competitor Analysis #Graph #Other
-

Weather Area Chart – Market Trend Analysis
#Market and Competitor Analysis #Graph #Other
-

Five Color Powerpoint Template Wide – Charts and Mockups
#Market and Competitor Analysis #Graph #Other
-

Comparative Analysis Area Graph – Enhancing Market Competitiveness
#Market and Competitor Analysis #Graph #Other
