Partial Highlight Area Graph – Market Trends and Competitive Advantage
RJ0500003_14
- Last Update 06/08/2025
- File Size 4.4MB
- # of Slides 2
- File Format PPTX
- Slide Ratio 16:9
- Color
Keywords
- #Content-Based Slides
- #Design-Based Slides
- #Market and Competitor Analysis
- #Graph
- #Other
- #Industry Trends
- #Competitive Advantage
- #16:9
- #area chart PowerPoint slide
- #partial highlight area graph design
- #market analysis chart slide
- #competitive advantage comparison
- #data visualization PPT
- #how to create area chart in PowerPoint
About the Product
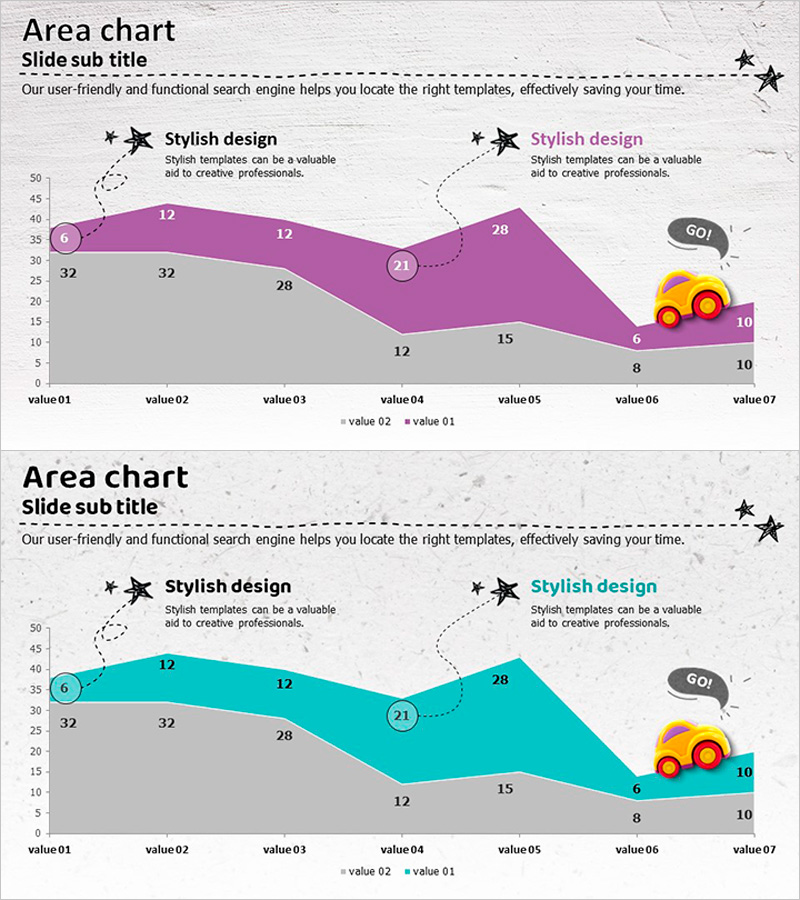
An area chart PowerPoint slide designed to visualize market analysis and competitive advantage with clarity and impact. Available in two color versions—purple and cyan—this slide tracks seven data points across a dynamic trend line, making performance variations immediately apparent. The partial highlight layout emphasizes key competitive advantages while the baseline comparison reveals performance gaps at a glance. Ideal for presentations and reports, this slide template enables you to communicate quantitative insights persuasively and integrate data-driven narratives into your pitch deck or strategic briefing.
Usage Points
-
Main Usage
Optimized for market analysis and competitive benchmarking, this slide simultaneously displays trend progression and performance differentials. The partial highlight region visually emphasizes your competitive edge, strengthening data credibility in investor pitches, stakeholder briefings, and executive presentations.
-
How to Use
Input your actual figures into the seven designated data point fields, and the graph updates automatically. Select either the purple or cyan color version to align with your corporate brand identity, then customize the legend and axis labels to match your presentation context and messaging.
-
Recommended For
Perfect for market overview, competitive analysis, and SWOT assessment sections. Deploy this slide in executive reports, investment pitch decks, strategic planning presentations, and marketing analysis materials where quantitative evidence strengthens your narrative.
-
Slide Structure
Title and subtitle input area at the top, dual-layer area chart in the center (upper highlight zone plus baseline reference), and legend with annotation space on the right. Text explanation areas and data visualization zones are balanced for professional impact.
Related Products
-

Weather Area Chart – Market Trend Analysis
#Market and Competitor Analysis #Graph #Other
-

Illustration Glass Bottle Segmentation Graph – Market Trend Analysis
#Market and Competitor Analysis #Graph #Other
-

Comparative Analysis Area Graph – Enhancing Market Competitiveness
#Market and Competitor Analysis #Graph #Other
-

Five Color Powerpoint Template Wide – Charts and Mockups
#Market and Competitor Analysis #Graph #Other
