User Gender Ratio Analysis Graph – Essential Tool for Market and Customer Analysis
RJ0300024_13
- Last Update 04/24/2025
- File Size 0.6MB
- # of Slides 2
- File Format PPTX
- Slide Ratio 16:9
- Color
Keywords
- #Content-Based Slides
- #Design-Based Slides
- #Market and Competitor Analysis
- #Graph
- #Other
- #Customer Analysis
- #Market Analysis
- #Other
- #Other Charts
- #Mockup
- #16:9
- #gender ratio analysis chart
- #user gender PowerPoint slide
- #market analysis presentation
- #customer demographics graph
- #gender composition chart
- #mockup slide template
About the Product
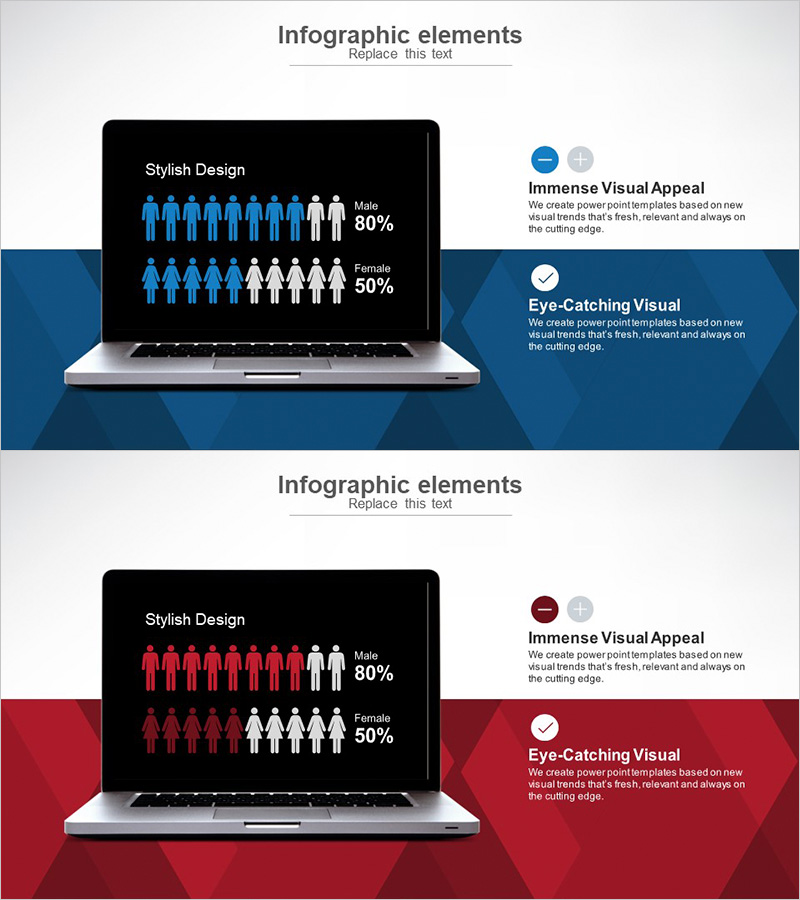
A 2-slide PowerPoint presentation set for visualizing user gender ratio analysis. Male and female proportions are represented using silhouette icons with clear percentage labels. Two color versions—blue and red—are provided to match your corporate brand identity. The laptop mockup design creates a realistic presentation display effect, making it ideal for market analysis, customer segmentation, marketing strategy presentations, business reports, and investor pitches. Delivered in 16:9 widescreen PPTX format, fully editable in all PowerPoint versions.
Usage Points
-
Main Usage
Clearly communicate user or customer gender distribution and support data-driven decision-making in market segmentation and targeting strategies. The visual comparison of male-to-female ratios enhances report credibility and audience comprehension.
-
How to Use
Insert this slide in the market analysis or customer insights section of your presentation. Replace the sample percentages with your actual data and select either the blue or red version to align with your brand colors. The laptop mockup background adds professional polish to your presentation.
-
Recommended For
Marketing professionals, business analysts, product managers, and executives presenting market research findings, user statistics, or customer demographic analysis. Suitable for business plans, marketing strategy decks, market research reports, investor presentations, and product launch materials.
-
Slide Structure
Two-slide layout featuring a laptop mockup containing silhouette icons (8 male and 8 female figures) with percentage values (80% and 50%). Right-aligned text boxes highlight 'Immense Visual Appeal' and 'Eye-Catching Visual' messaging. Blue-themed slide (top) and red-themed slide (bottom) provide color variation options.
Related Products
-

User Analysis Results Diagram - Infographic for Customer Insights
#Market and Competitor Analysis #Graph #Other
-

Medical Services Characteristics Connection Diagram
#Market and Competitor Analysis #Graph #Customer Analysis
-

Customer Analysis Line Graph – Visualizing Market Insights
#Market and Competitor Analysis #Graph #Customer Analysis
-

User Gender Ratio Analysis Graph – Data Visualization
#Market and Competitor Analysis #Graph #Customer Analysis
