Comparative Chart of Male and Female Professionals
RB0100032_5
- Last Update 03/04/2025
- File Size 3.2MB
- # of Slides 2
- File Format PPTX
- Slide Ratio 4:3
- Color
Keywords
- #Content-Based Slides
- #Design-Based Slides
- #Market and Competitor Analysis
- #Graph
- #Other
- #Customer Analysis
- #Market Analysis
- #Column
- #Grouped Column
- #Silhouette
- #4:3
- #silhouette chart PowerPoint
- #comparative analysis graph
- #bar chart slide template
- #professional data visualization
- #gender comparison chart PPT
About the Product
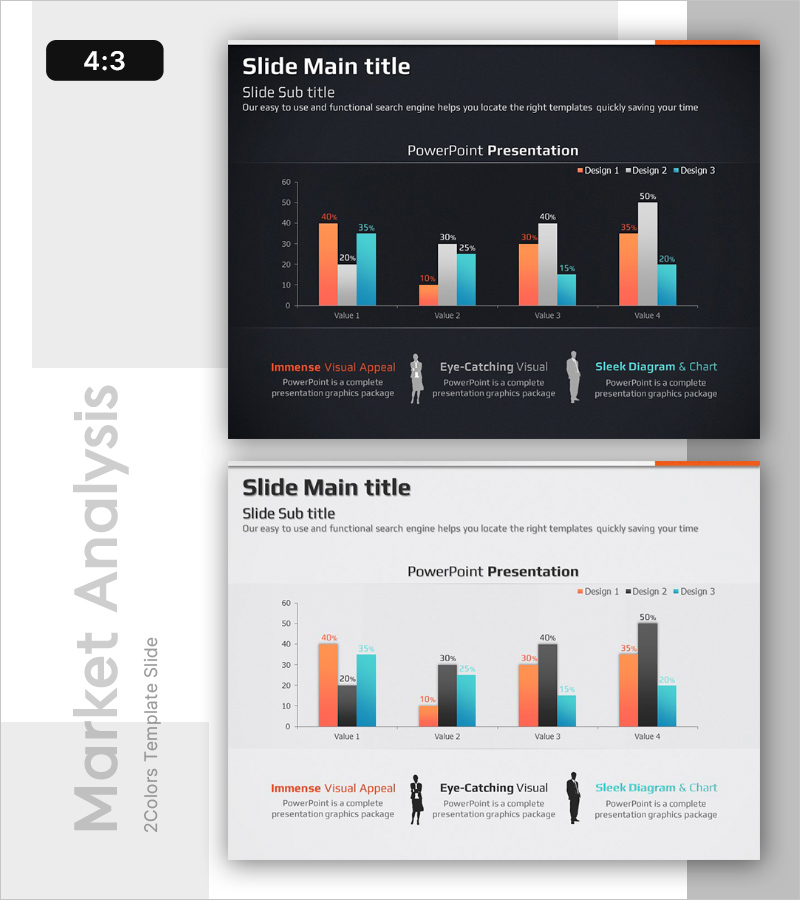
A comparative analysis chart PowerPoint slide featuring male and female professional silhouettes. The design uses a dark background with three color series—orange, white, and cyan—arranged in a bar graph to visually compare four data values. Each silhouette includes a text description area below, making it ideal for gender-based, hierarchical, or departmental data analysis. The 2-slide set provides both dark and light background versions in 4:3 ratio PPTX format, fully editable for immediate use. Perfect for HR presentations, performance reports, diversity and inclusion initiatives, and organizational analysis slides.
Usage Points
-
Main Usage
Visualize gender-based, hierarchical, or departmental data using professional silhouettes paired with multi-series bar graphs. The three color series enable simultaneous representation of multiple metrics, making it highly effective for HR statistics, organizational analysis, and diversity reporting.
-
How to Use
Replace the Value 1–4 labels and numbers with your actual data. Edit the text descriptions below each silhouette to specify job level, department, or region. Adjust bar heights and percentages to emphasize comparison points. Select either the dark or light background version based on your presentation environment.
-
Recommended For
HR and personnel department organizational presentations, performance evaluation reports, diversity and inclusion (D&I) initiative presentations, executive briefings, recruitment and workforce planning sessions, and gender or age-based statistical analysis materials.
-
Slide Structure
2-slide set. Each slide contains a title and subtitle area, a central bar graph with 4 data items across 3 color series, and 3 professional silhouettes (male, female, neutral) with descriptive text boxes below. 4:3 aspect ratio, PPTX format with all elements fully editable.
Related Products
-

The Difference in the Ratio of Men and Women by Age – Gender Customer Analysis
#Market and Competitor Analysis #Graph #Customer Analysis
-

Orange Hexagon Presentation Template Segmented Vertical Bar Graph – Market and Competitive Analysis
#Market and Competitor Analysis #Graph #Other
-

Gender Ratio Customer Analysis 3D Circle Graph – Insights for Market Understanding
#Market and Competitor Analysis #Graph #Other
-

Layout Design Presentation Template for Market & Competitor Analysis – Column Chart
#Market and Competitor Analysis #Graph #Customer Analysis
