Dual Line Chart with Comments – Market Trend Analysis
RB0800054_5
- Last Update 03/26/2025
- File Size 0.4MB
- # of Slides 2
- File Format PPTX
- Slide Ratio 4:3
- Color
Keywords
- #Content-Based Slides
- #Design-Based Slides
- #Market and Competitor Analysis
- #Graph
- #Text Box
- #Industry Trends
- #Competitive Advantage
- #Line
- #Line Chart
- #Speech Bubble
- #4:3
- #dual line chart PowerPoint
- #market trend analysis slide
- #2-series comparison chart
- #competitive analysis PowerPoint template
- #trend visualization slide download
About the Product
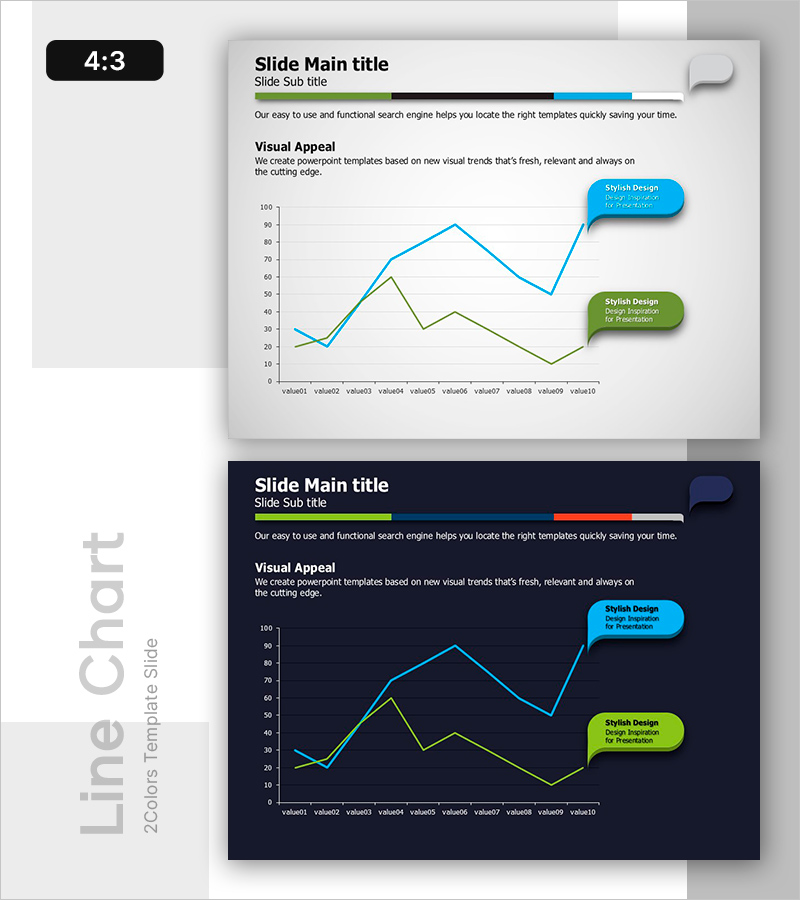
A dual line chart PowerPoint slide designed to compare market trends and competitive positioning across two data series. The slide features blue and green lines tracking 10 data points over time, with speech bubble callouts to highlight key insights and strategic observations. Two design versions are provided—light background and dark background—allowing you to match your presentation environment. This 4:3 ratio, 2-slide template is fully editable and ready for immediate use in business presentations.
Usage Points
-
Main Usage
Visualize changes in two related metrics—such as market trends, sales performance, or competitive benchmarks—across multiple time periods, with strategic callouts to guide audience interpretation and decision-making.
-
How to Use
Input your 10 data points for each series, adjust line colors as needed, and add key messages to the speech bubble callouts. Select either the light or dark background version based on your presentation setting and display environment.
-
Recommended For
Executive reports, business performance reviews, marketing strategy meetings, investor pitches, and market analysis seminars. Ideal for executives, marketing professionals, data analysts, and consultants who need to present quantitative comparisons with strategic commentary.
-
Slide Structure
2-slide template featuring dual line charts with 10 data points per series (blue and green lines), 2 speech bubble callout areas per slide, and both light and dark background design options for flexible presentation use.
Related Products
-

Line Chart Template for Market Trends Visualization – Enhancing Competitive Advantage
#Market and Competitor Analysis #Graph #Industry Trends
-

Plotting Paper Presentation Template - Analyzing Market Trends with Line Chart
#Market and Competitor Analysis #Graph #Industry Trends
-

Arctic Penguin Line Graph – Market Trend Analysis
#Market and Competitor Analysis #Graph #Industry Trends
-

Market Trend Line Graph – Effective Competitive Advantage Analysis
#Market and Competitor Analysis #Graph #Industry Trends
