Sales Status Table and Analysis – Clustered Column Charts for Competitor Analysis
RJ0600077_18
- Last Update 07/10/2025
- File Size 6.2MB
- # of Slides 2
- File Format PPTX
- Slide Ratio 16:9
- Color
Keywords
- #Content-Based Slides
- #Design-Based Slides
- #Market and Competitor Analysis
- #Graph
- #Text Box
- #Competitor Analysis
- #Competitive Advantage
- #Column
- #Grouped Column
- #Speech Bubble
- #16:9
- #clustered column chart PowerPoint
- #bar chart slide template
- #sales comparison graph
- #competitor analysis chart
- #2-series data visualization PowerPoint
About the Product
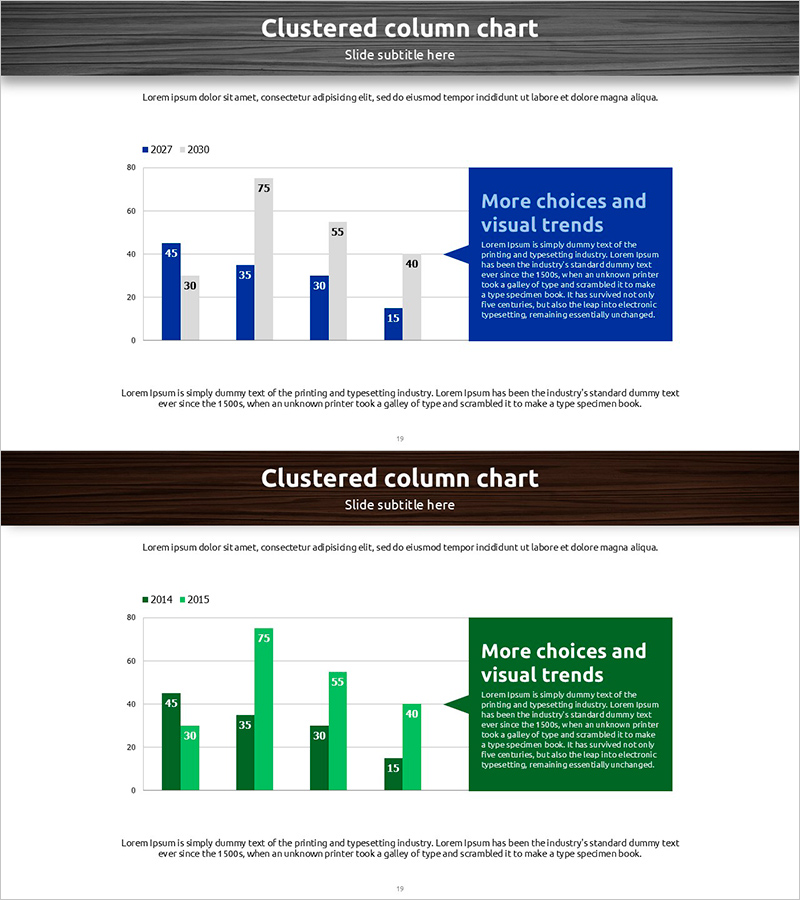
A clustered column chart PowerPoint slide designed for sales performance and competitor analysis presentations. This template displays 6 data categories with 2 series (2027 vs 2030, or 2014 vs 2015) side by side, enabling clear year-over-year or competitive comparison. The design features a dark gray header with white background and uses navy blue with light gray, or dark green with light green color schemes to distinguish data series. Each slide includes a descriptive text area and a prominent message box for highlighting key insights. This presentation template is ready to use in market analysis, sales performance reports, competitive analysis sections, and strategic business documents.
Usage Points
-
Main Usage
Ideal for comparing two data series such as sales figures, competitor metrics, or year-over-year trends. The side-by-side column arrangement makes numerical differences immediately apparent, while color differentiation between series enhances audience comprehension and engagement.
-
How to Use
Replace the sample numbers and legend with your actual data. Select either the blue or green color version to match your corporate branding. Edit the text box descriptions with your analysis findings and use the slide in your presentation.
-
Recommended For
Sales and marketing team performance reports, executive-level competitor analysis presentations, market analysis sections in business plans, quarterly or annual performance comparison decks, and strategic planning meetings.
-
Slide Structure
2-slide set. Each slide contains a dark gray header (title and subtitle area), a clustered column chart with 6 categories and 2 series (Y-axis scale 0–80), a prominent message box on the right (navy blue or dark green background), and a descriptive text section at the bottom for additional context.
Related Products
-

Competitor Comparative Analysis Slide – Emphasizing Market and Competitiveness
#Market and Competitor Analysis #Graph #Text Box
-

Market Competition: Deep Dive into Top 3 Firms
#Market and Competitor Analysis #Graph #Competitor Analysis
-

Market Trend Visualized with Vertical Bar Graph
#Market and Competitor Analysis #Graph #Competitor Analysis
-

Analyzing 2 Comparison Graphs - Slides for Deriving Competitive Advantage
#Market and Competitor Analysis #Graph #Competitor Analysis
