Customer Analysis and Market Share Graph – Harmony of Blue and Red
RJ0400020_21
- Last Update 05/23/2025
- File Size 0.2MB
- # of Slides 2
- File Format PPTX
- Slide Ratio 16:9
- Color
Keywords
About the Product
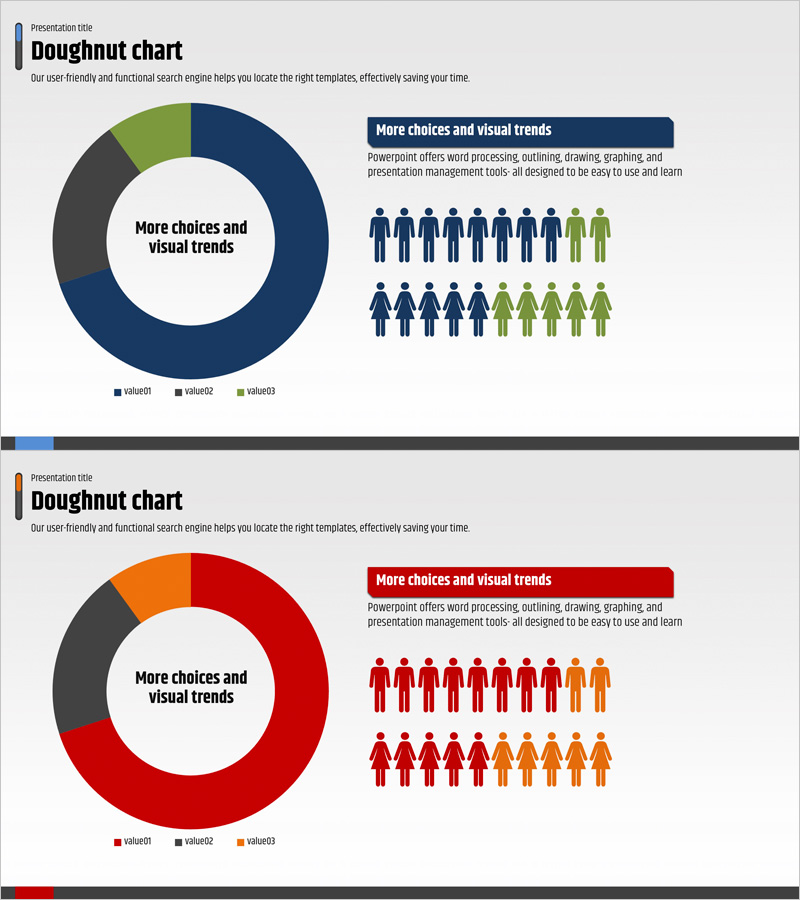
A doughnut chart PowerPoint slide designed to visualize customer analysis and market share distribution. The slide features a three-segment donut graph in navy, gray, and lime green, paired with infographic elements (people icons) to represent both data proportions and customer segments simultaneously. Two slide layouts are provided—one with navy tones and one with red tones—allowing you to match your presentation theme and brand colors. Optimized for 16:9 widescreen format in PPTX, the slides are fully editable and ready for immediate use with your actual data.
Usage Points
-
Main Usage
Clearly express proportional relationships such as customer segment distribution, market share, and revenue composition using a doughnut chart format. The center space accommodates key messages or figures for emphasis, while the right-side infographic conveys additional customer demographic information.
-
How to Use
Apply this slide in business presentations, marketing strategy meetings, quarterly performance reports, and investor pitch decks—particularly in customer analysis and market overview sections. Edit the donut segments with actual proportion data, customize the legend and figures, and adjust the layout to match your presentation context.
-
Recommended For
Marketing managers, sales directors, executives, management consultants, and data analysts who need to communicate customer insights, market conditions, and business performance with visual clarity and persuasion. Especially effective for strategy meetings and external presentations requiring ratio-based decision-making.
-
Slide Structure
Slide 1: Navy background with 3-segment doughnut chart + center text area + right-side people icon infographic (2 rows × 5 columns). Slide 2: Red background with identical structure. Both slides use 16:9 widescreen layout with clearly separated title, chart, and legend areas.
Related Products
-

Market Share Donut Pie Chart & Silhouette – Unique Design and Information Delivery
#Market and Competitor Analysis #Graph #Other
-

Customer Analysis Donut Chart - Visualizing Market Share
#Market and Competitor Analysis #Graph #Other
-

Customer Share Analysis Chart – Insights for Successful Business
#Market and Competitor Analysis #Graph #Other
-

Important Things in Sea Travel – Customer Analysis Data Visualization
#Market and Competitor Analysis #Graph #Customer Analysis
