User Gender Ratio Analysis Graph – Visualizing Market Share
RJ0300030_7
- Last Update 04/26/2025
- File Size 1MB
- # of Slides 2
- File Format PPTX
- Slide Ratio 16:9
- Color
Keywords
- #Content-Based Slides
- #Design-Based Slides
- #Market and Competitor Analysis
- #Graph
- #Customer Analysis
- #Market Share
- #Circles
- #Other
- #Doughnut Chart
- #Other Charts
- #16:9
- #doughnut chart PowerPoint
- #gender ratio analysis slide
- #market share visualization
- #customer analysis chart
- #doughnut chart template download
- #ratio visualization presentation
About the Product
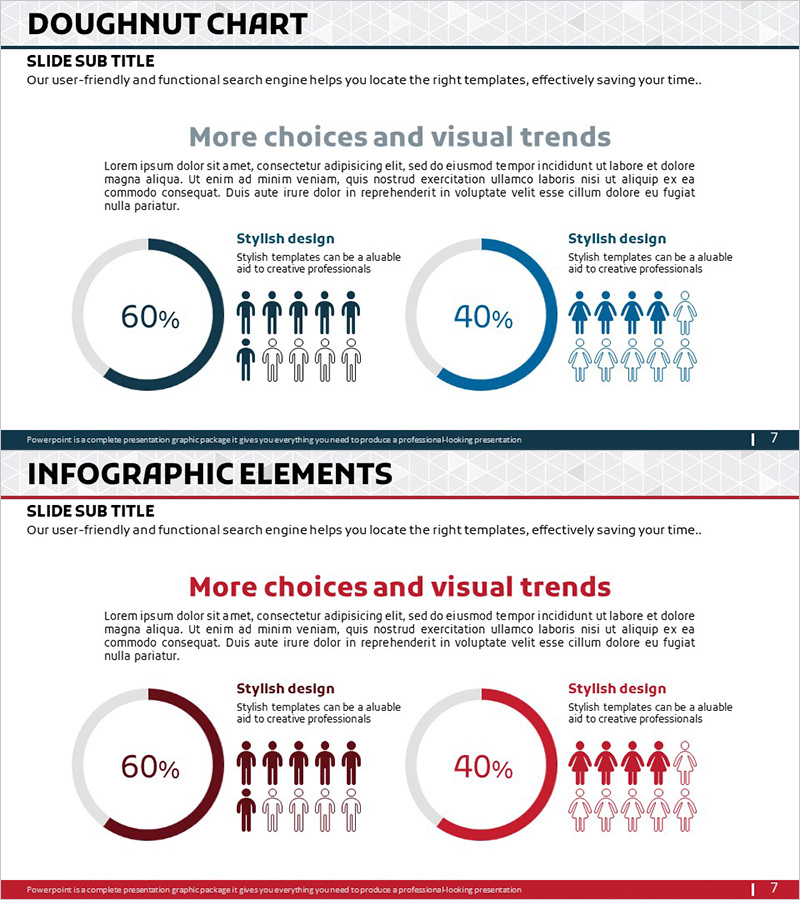
A doughnut chart PowerPoint slide designed to visualize user gender ratio and market share analysis. Featuring a two-tone color scheme of navy and light blue, the dual doughnut charts clearly represent 60% and 40% data proportions. Human icons positioned beside each chart provide intuitive visual communication of gender composition. This 2-slide set includes both navy and wine-red themed versions, allowing you to match your corporate branding. Ideal for customer analysis and market analysis sections in business presentations and reports.
Usage Points
-
Main Usage
Clearly express two-item ratio data such as user gender composition, customer demographics, and market share using doughnut charts, with human icons providing intuitive visual representation of gender and demographic information. Serves as a key visualization tool in marketing, sales, and HR reports for target audience analysis sections.
-
How to Use
Replace the doughnut chart values (60%, 40%) with your actual data and adjust the number of human icons to reflect gender composition ratios. Edit the slide title and descriptive text to add analytical context, then use directly in customer analysis, market analysis, or organizational structure presentations.
-
Recommended For
Marketing team target audience analysis presentations, sales team market share reports, HR team organizational composition updates, executive quarterly performance reports, investor-focused customer base analysis materials, and demographic trend analysis slides.
-
Slide Structure
2-slide set with dual doughnut charts (60% and 40% proportions) positioned side-by-side on each slide. Human icons (10 per chart) are arranged beside each doughnut to emphasize gender composition visually. Slide 1 features navy and light blue tones; Slide 2 offers wine-red and light pink tones for flexible brand alignment.
Related Products
-

Visually Appealing Infographic Slide – Interesting Design
#Market and Competitor Analysis #Graph #Customer Analysis
-

Causes of Stress for Office Workers – Visualized Donut Chart
#Market and Competitor Analysis #Graph #Customer Analysis
-

Doughnut Chart for System Development Status Progress Visualization
#Product/Service Introduction #Market and Competitor Analysis #Graph
-

Customer Analysis Donut Chart - Visualizing Market Share
#Market and Competitor Analysis #Graph #Other
