Consumer Analysis Status Graph – Visualizing Market Share
RM0100005_13
- Last Update 01/25/2025
- File Size 0.4MB
- # of Slides 2
- File Format PPTX
- Slide Ratio 16:9
- Color
Keywords
- #Content-Based Slides
- #Design-Based Slides
- #Market and Competitor Analysis
- #Diagram
- #Graph
- #Customer Analysis
- #Market Share
- #Table
- #Circles
- #Doughnut Chart
- #16:9
- #donut chart PowerPoint slide
- #pie chart template
- #market share visualization
- #consumer analysis graph
- #donut chart slide design
- #percentage data PowerPoint
- #how to create donut chart in PowerPoint
About the Product
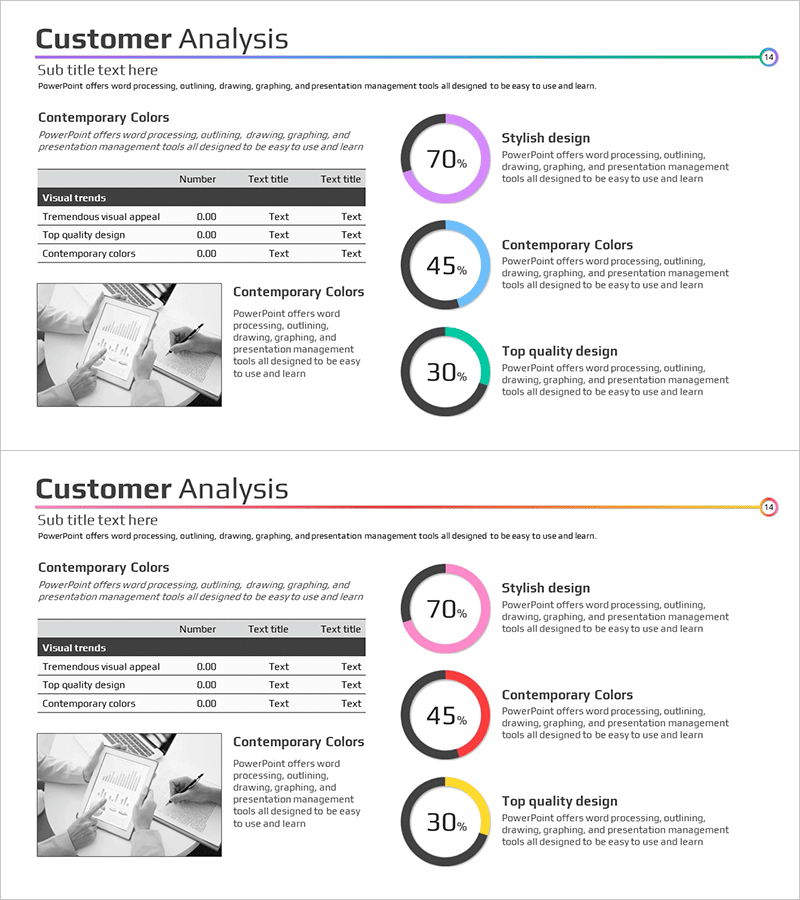
A donut chart PowerPoint slide designed to visualize consumer analysis and market share data. This presentation template features three data series displayed as percentages using a gradient donut chart in purple, blue, and teal colors. The slide is ready to use for customer analysis, market status reports, and brand share presentations. With 2 slides in 16:9 widescreen format, it provides flexible layout variations that work seamlessly in any presentation environment. All text and data fields are fully editable for quick customization.
Usage Points
-
Main Usage
Visualize ratio and percentage data such as market share, customer segmentation, and brand comparison using an intuitive donut chart format. The 3-segment design with percentage values enhances audience comprehension of data distribution.
-
How to Use
Use in business reports, marketing plans, investor presentations, and quarterly performance reviews to present market overview and customer analysis sections. Click on each donut segment to edit values and labels directly within PowerPoint.
-
Recommended For
Marketing managers, sales directors, executives, consultants, and market analysts presenting customer segmentation, market share analysis, and sales distribution. Particularly effective for B2B proposals and executive reports.
-
Slide Structure
2-slide set featuring two donut chart layout variations. Each slide includes a 3-segment donut chart (purple 70%, blue 45%, teal 30%), title, subtitle, and description text areas. Optimized for 16:9 widescreen format with fully editable data fields.
Related Products
-

Customer Share Analysis Chart – Insights for Successful Business
#Market and Competitor Analysis #Graph #Other
-

Travel App Market Share and Customer Evaluation Donut Chart
#Market and Competitor Analysis #Graph #Customer Analysis
-

Travel Agency Market Share and Trends – Data Slide for Competitive Advantage
#Market and Competitor Analysis #Diagram #Graph
-

Stylish Data Visualization Slide – Insights for CEO Presentation
#Company Introduction #Market and Competitor Analysis #Diagram
