Frustration and Leap Donut Chart
RJ0600016_17
- Last Update 06/24/2025
- File Size 0.3MB
- # of Slides 2
- File Format PPTX
- Slide Ratio 16:9
- Color
Keywords
About the Product
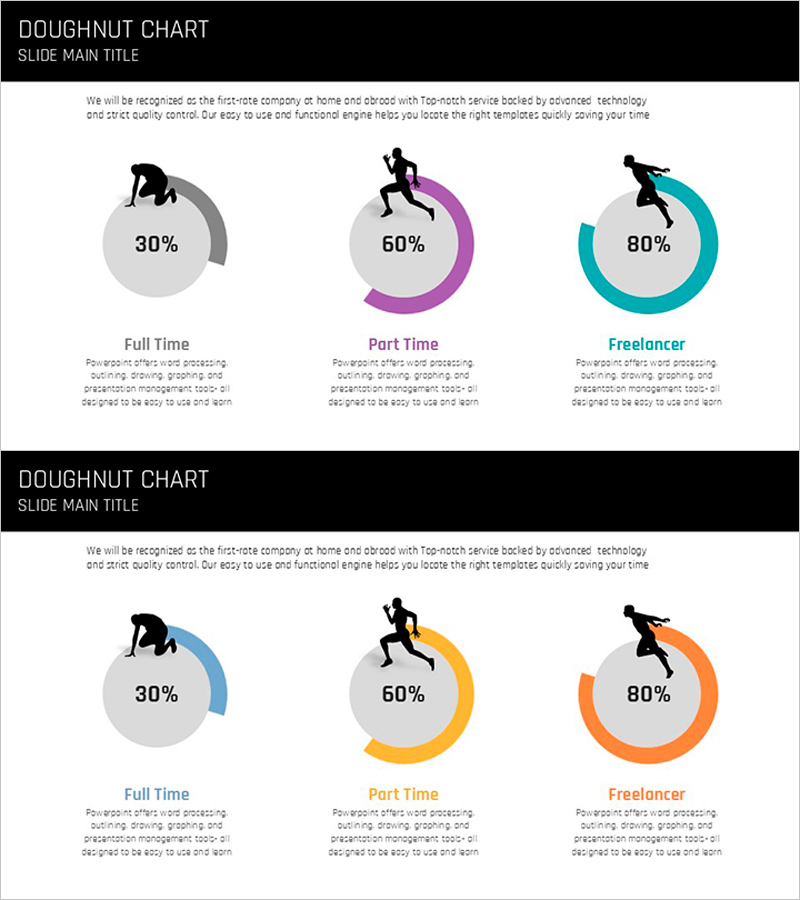
A PowerPoint slide featuring three donut charts that visualize employment type ratios: Full Time, Part Time, and Freelancer. Each chart displays data percentages (30%, 60%, 80%) with colored arcs (blue, purple, teal) overlaid on gray circular backgrounds, accompanied by silhouette icons and clear category labels. The 2-slide deck offers two color variations—one with blue, purple, and teal accents, and another with blue, orange, and orange tones—making it ideal for customer segmentation, market share analysis, organizational structure, and budget allocation presentations. Fully editable PPTX format in 16:9 widescreen ratio compatible with all PowerPoint versions.
Usage Points
-
Main Usage
Simultaneously compare three data categories using donut charts—perfect for displaying customer segments, market share distribution, organizational composition, or budget allocation. Each donut chart operates independently, allowing flexible data updates while maintaining consistent color-coded visual hierarchy across the presentation.
-
How to Use
Slide 1 features blue, purple, and teal color combinations; Slide 2 uses blue, orange, and orange. Double-click each donut arc to edit percentage values and modify category labels (Full Time, Part Time, Freelancer) to match your organizational context. Adjust the arc lengths proportionally to reflect actual data.
-
Recommended For
Marketing plans, business reports, customer analysis documents, organizational updates, and market analysis presentations. Recommended for managers, executives, data analysts, and business development professionals who need to present multi-category ratio comparisons.
-
Slide Structure
Each slide contains 3 donut charts arranged horizontally. Every chart consists of a gray circular background with a colored arc overlay representing data percentage, topped with a category label and silhouette icon, and includes descriptive text space below. Both slides maintain identical layouts with only color variations.
Related Products
-

Causes of Stress for Office Workers – Visualized Donut Chart
#Market and Competitor Analysis #Graph #Customer Analysis
-

User Gender Ratio Analysis Graph – Visualizing Market Share
#Market and Competitor Analysis #Graph #Customer Analysis
-

Donut Chart Slide Visualizing Marriage Survey Data
#Market and Competitor Analysis #Graph #Customer Analysis
-

Important Things in Sea Travel – Customer Analysis Data Visualization
#Market and Competitor Analysis #Graph #Customer Analysis
