Plant Cultivation Awareness Graph – Visualizing Market Status with Horizontal Bar
RJ0800008_16
- Last Update 08/01/2025
- File Size 1.8MB
- # of Slides 2
- File Format PPTX
- Slide Ratio 16:9
- Color
Keywords
- #Content-Based Slides
- #Design-Based Slides
- #Market and Competitor Analysis
- #Graph
- #Market Status
- #Industry Trends
- #Horizontal Bar
- #Segmented Horizontal Bar
- #16:9
- #horizontal bar chart PowerPoint
- #market trend analysis slides
- #data comparison presentation
- #market status visualization
- #how to create bar chart in PowerPoint
About the Product
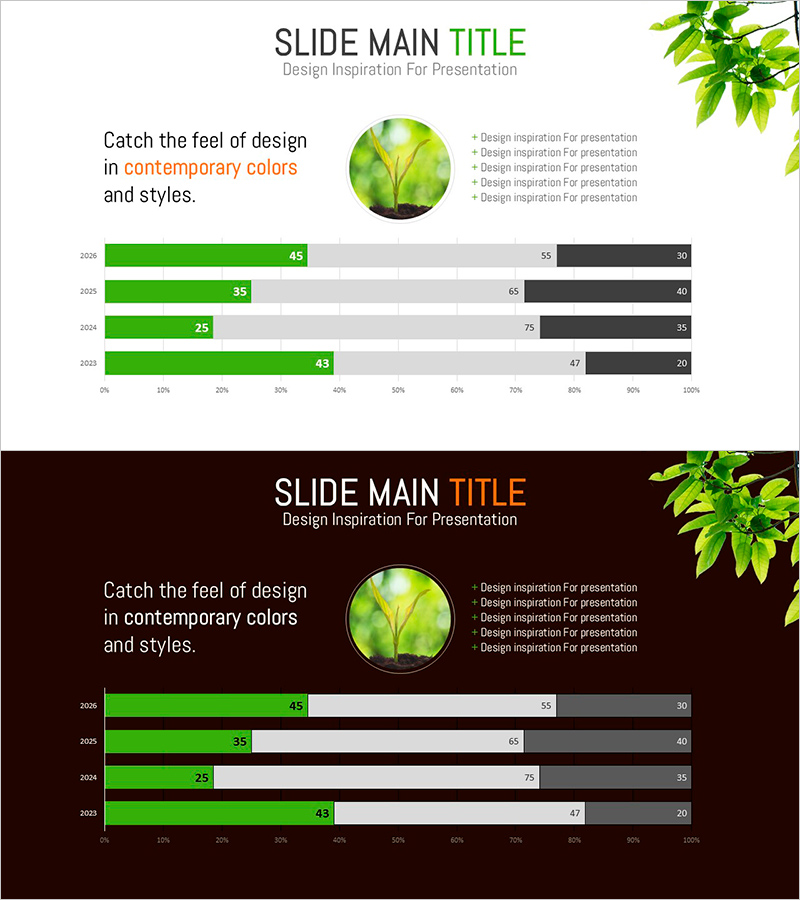
A horizontal bar chart PowerPoint slide comparing plant cultivation market awareness across four years with dual-layout design. This presentation slide features both light and dark background versions, utilizing green accent bars and gray supporting bars to create visual contrast for intuitive data representation. Each year's metrics (45, 35, 25, 43) are clearly displayed, making this slide template ideal for sales reports, marketing presentations, market analysis decks, and business development slides.
Usage Points
-
Main Usage
Visualize year-over-year numerical comparisons such as market research data, sales performance, and awareness metrics using horizontal bar charts. The contrasting green and gray color scheme effectively distinguishes primary and secondary indicators, enhancing audience comprehension of complex data trends.
-
How to Use
Deploy in market analysis sections of marketing plans, performance review pages in business reports, and market status slides in investor pitch decks. Use the light background layout for daytime presentations and the dark background for evening events or premium-atmosphere presentations.
-
Recommended For
Marketing professionals, market analysts, business planners, sales managers, and executives presenting market trends, customer awareness metrics, and sales performance. Particularly effective when emphasizing year-over-year change patterns and comparative growth analysis.
-
Slide Structure
Two-slide template featuring light background (top) and dark background (bottom) layouts. Each slide contains title area, descriptive text, circular image element, and horizontal bar chart spanning four years (2026, 2025, 2024, 2023) with dual-series data visualization (green and gray bars), representing eight total data points per slide.
Related Products
-

Market Status and Trend Graph – Harmony of Blue and Orange
#Market and Competitor Analysis #Graph #Market Status
-

Technology Service Market Trends and Status – 100% Stacked Bar Chart
#Market and Competitor Analysis #Graph #Market Status
-

Construction Progress Chart – Business Introduction and Market Analysis
#Business Introduction #Market and Competitor Analysis #Graph
-

Horizontal Bar Chart Slide for Four-Year Change Figures
#Market and Competitor Analysis #Graph #Industry Trends
