Current Status Graph Analysis and Forecast – Market and Competitor Analysis
RJ0900017_11
- Last Update 08/20/2025
- File Size 0.3MB
- # of Slides 2
- File Format PPTX
- Slide Ratio 16:9
- Color
Keywords
About the Product
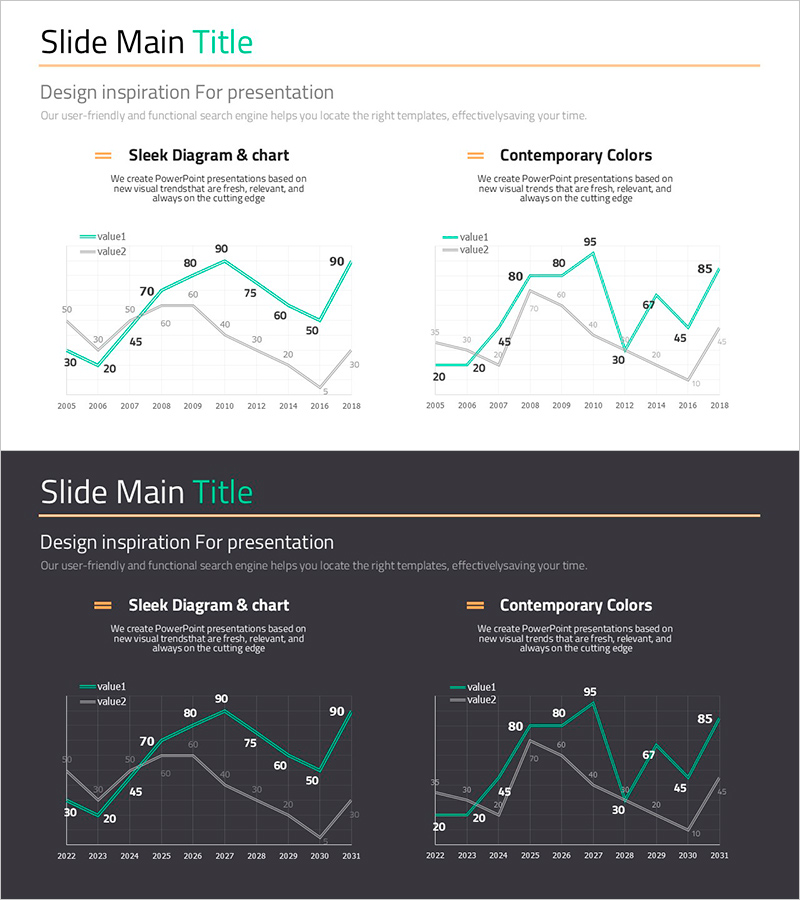
A line chart PowerPoint slide designed for market analysis and competitive benchmarking. This presentation template visualizes two data series across multiple years to highlight trend changes and performance comparisons. The slide includes both light and dark background versions with contrasting orange and teal color schemes for clear data differentiation. Numerical labels on each data point ensure precise value communication. Ready to use in business reports, market analysis presentations, and strategic briefings.
Usage Points
-
Main Usage
Visualizes year-over-year data trends across two comparable series for market analysis and competitive positioning. Effectively communicates changes in market share, revenue growth, customer satisfaction, or performance metrics. The contrasting color scheme and numerical labels enable clear comparison and precise value communication to stakeholders.
-
How to Use
Insert into business reports, quarterly presentations, investor pitches, and strategic planning meetings. Choose the light background version for bright-themed decks or the dark version for dark-themed presentations. Replace sample data values and legend labels with your actual metrics. Adjust axis ranges and data points as needed for your specific analysis.
-
Recommended For
Executives, marketing teams, sales professionals, business analysts, and management consultants presenting market trends and competitive analysis. Ideal for business plans, quarterly reports, investor relations materials, and strategic decision-making presentations. Suitable for any presentation requiring quantitative data comparison over time.
-
Slide Structure
Two-slide set featuring dual-series line charts with years 2005-2018 on the horizontal axis and numerical values 0-100 on the vertical axis. Each data point displays precise numerical labels. Orange and teal color schemes distinguish the two data series. Both light and dark background versions are included for template flexibility.
Related Products
-

Purple Turquoise Line Chart – Market Analysis and Future Outlook
#Market and Competitor Analysis #Graph #Future Outlook
-

Line Chart of Notepad Frame – Market and Competitor Analysis
#Market and Competitor Analysis #Graph #Future Outlook
-

Eco-friendly Business Future Outlook Line Graph – Market Analysis
#Market and Competitor Analysis #Graph #Future Outlook
-

Line Charts for Design Tasks – Market and Competitor Analysis
#Market and Competitor Analysis #Graph #Future Outlook
