Line Graph Market Research by Year – Market Trend Analysis
RJ0600028_7
- Last Update 06/28/2025
- File Size 4.1MB
- # of Slides 2
- File Format PPTX
- Slide Ratio 16:9
- Color
Keywords
About the Product
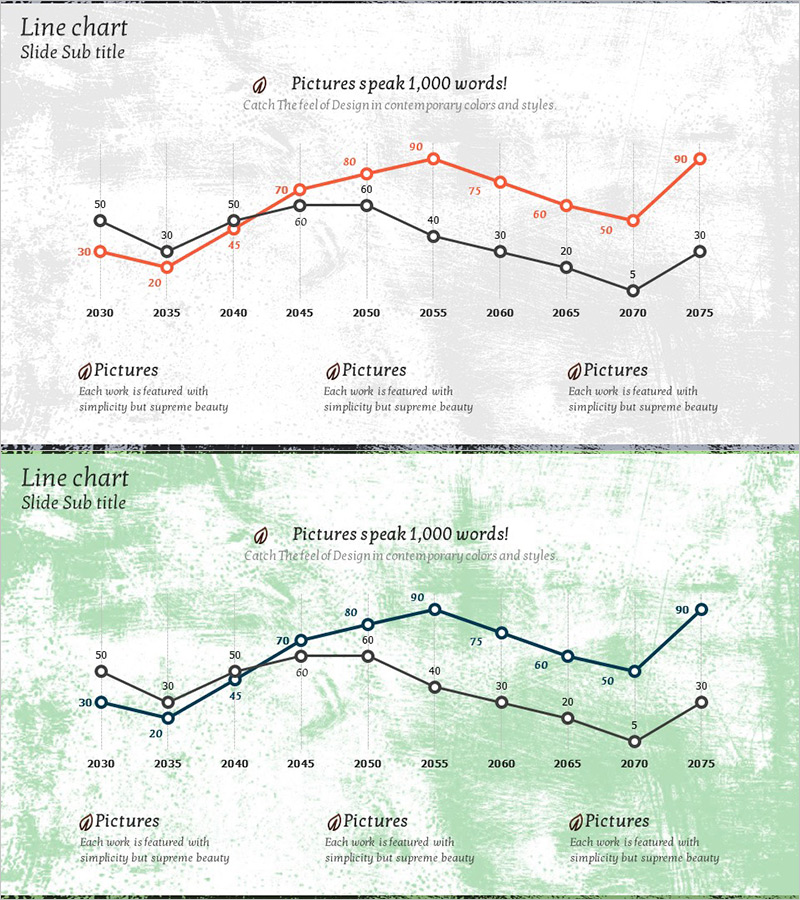
A PowerPoint slide featuring a multi-line chart tracking market data from 2030 to 2075 across three distinct data series. Red, black, and gray trend lines clearly visualize numerical changes over time, with data points ranging from 30 to 90 on the Y-axis. A grid background enhances readability and supports precise value interpretation. This presentation slide is ready to use for market research reports, competitive analysis, sales forecasting, and strategic planning presentations. Two slide layouts are included with contrasting backgrounds—neutral gray and soft green—allowing flexible integration into different presentation themes.
Usage Points
-
Main Usage
Designed to compare and analyze long-term market data across multiple indicators simultaneously. Ideal for presenting competitive revenue trends, market growth rates, customer satisfaction metrics, and other KPIs that evolve over time. The time-based X-axis enables intuitive communication of change patterns and future projections.
-
How to Use
Replace the sample data points and numerical values with your actual market figures. Customize line colors, thickness, and marker styles to emphasize key metrics. Select either the gray-tone or green-tone background version to match your overall presentation design and corporate branding.
-
Recommended For
Marketing professionals, strategy planners, financial analysts, and executives preparing data-driven presentations. Suitable for market research findings, quarterly performance reviews, business planning sessions, investor presentations, and board-level strategic discussions where data credibility is essential.
-
Slide Structure
Two-slide set with identical 3-series line chart layouts in different background colors (gray and green tones). X-axis displays years from 2030 to 2075 in 5-year intervals. Y-axis ranges from 0 to 100. Three data series each contain 30–90 value points. Grid lines and legend ensure clarity and professional appearance.
Related Products
-

Divorce Count Graph – Future Trends Analysis
#Market and Competitor Analysis #Graph #Future Outlook
-

Purple Turquoise Line Chart – Market Analysis and Future Outlook
#Market and Competitor Analysis #Graph #Future Outlook
-

Annual Growth Trends in Child Development
#Market and Competitor Analysis #Graph #Future Outlook
-

Line Graph and Key Messages – Market Outlook Analysis
#Market and Competitor Analysis #Graph #Future Outlook
