Line Chart of Notepad Frame – Market and Competitor Analysis
RJ0500047_21
- Last Update 06/20/2025
- File Size 0.2MB
- # of Slides 2
- File Format PPTX
- Slide Ratio 16:9
- Color
Keywords
- #Content-Based Slides
- #Design-Based Slides
- #Market and Competitor Analysis
- #Graph
- #Future Outlook
- #Market Analysis
- #Line
- #Line Chart
- #16:9
- #line chart PowerPoint
- #dual-series chart template
- #market analysis slide
- #competitor comparison graph
- #trend analysis presentation
- #data visualization PPT slide
About the Product
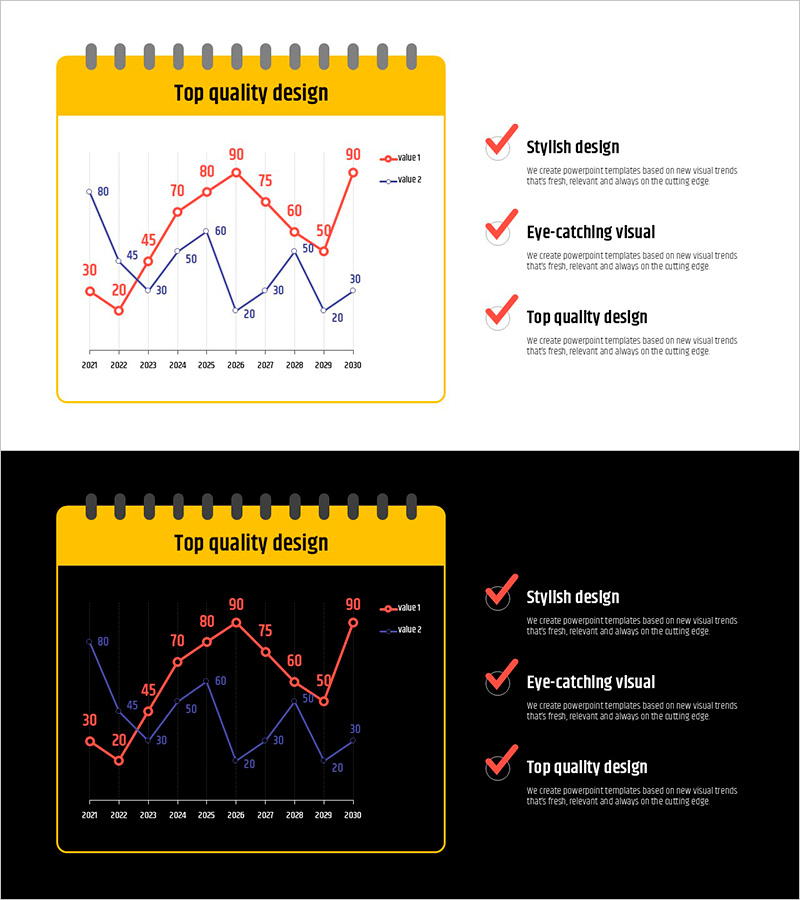
A PowerPoint slide featuring a dual-series line chart set within a notepad frame design. The chart displays market and competitor data from 2001 to 2030 in 10-year intervals, with red and blue lines representing two distinct data series. Each data point is labeled with numerical values for precise comparison of market shifts and competitive performance. The yellow notepad frame at the top emphasizes the title area, while the right side includes a legend and three checkmark text boxes for key insights. Two background versions—light and dark—are provided to suit various presentation environments and printing needs.
Usage Points
-
Main Usage
This slide is optimized for comparing market trends and competitor performance over time. The two line series enable simultaneous visualization of how two entities evolve, while numerical labels on each data point ensure precise data communication. It serves as a key evidence slide in the market analysis section of business plans, marketing proposals, and investor pitch decks.
-
How to Use
Open the slide and replace the red and blue line data values with your own market figures. Enter the analysis subjects (e.g., Domestic Market vs. Competitor) in the notepad frame title area, and summarize three key insights in the checkmark text boxes on the right. Select the light background version for printing and PDF distribution, or the dark version for screen presentations.
-
Recommended For
Ideal for executives, planning teams, marketing departments, and sales teams presenting market conditions and competitive positioning. Particularly effective in quarterly and annual business reports, new business proposals, and investor presentations for visualizing market size changes, market share trends, customer satisfaction comparisons, and other time-series metrics. Suitable for any data-driven business presentation requiring comparative analysis.
-
Slide Structure
The slide comprises three main sections: a yellow notepad frame at the top (title area), a central line chart with two data series (10 data points each, X-axis spanning 2001–2030, Y-axis ranging 0–90), and a right-side legend with three checkmark text boxes. All data points on the chart are labeled with numerical values, and the red and blue lines are clearly differentiated by the legend.
Related Products
-

Line Graph Market Research by Year – Market Trend Analysis
#Market and Competitor Analysis #Graph #Future Outlook
-

Divorce Count Graph – Future Trends Analysis
#Market and Competitor Analysis #Graph #Future Outlook
-

Current Status Graph Analysis and Forecast – Market and Competitor Analysis
#Market and Competitor Analysis #Graph #Future Outlook
-

Line Charts for Design Tasks – Market and Competitor Analysis
#Market and Competitor Analysis #Graph #Future Outlook
