Future Technology Industry Analysis Graph – Market Trends and Growth Prediction
RM0200015_13
- Last Update 02/05/2025
- File Size 0.9MB
- # of Slides 2
- File Format PPTX
- Slide Ratio 16:9
- Color
Keywords
- #Content-Based Slides
- #Design-Based Slides
- #Market and Competitor Analysis
- #Diagram
- #Graph
- #Future Outlook
- #Market Analysis
- #Table
- #Line
- #Standard Table
- #Line Chart
- #16:9
- #line chart PowerPoint slide
- #market trend analysis presentation
- #multi-series line graph
- #industry analysis chart
- #growth prediction slide
About the Product
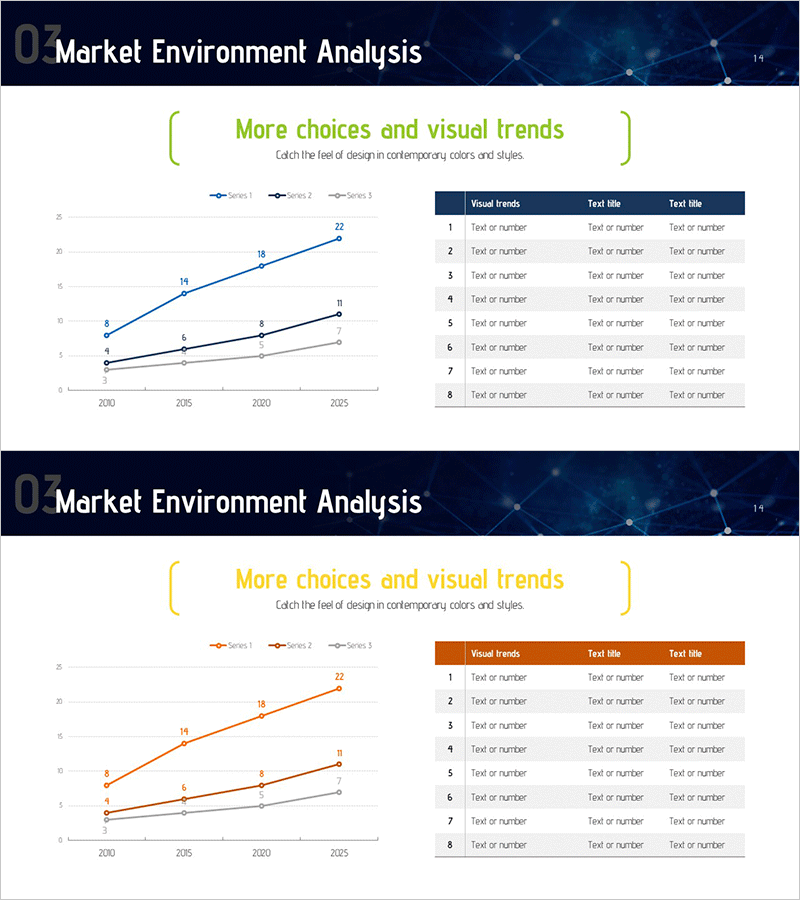
A multi-series line chart PowerPoint slide designed to visualize technology industry market trends from 2010 to 2025. The slide features three distinct data series represented in navy, orange, and gray colors, with clear data points and trend lines. A data table with eight rows is positioned on the right side to provide detailed numerical information. This presentation slide is ready to use for competitive analysis, growth forecasting, and industry trend reports.
Usage Points
-
Main Usage
Display technology industry market trends, compare competitor performance, and forecast long-term growth trajectories. Line charts effectively show change over time, making them ideal for investor presentations, executive reports, and industry analysis documents.
-
How to Use
Replace the sample data in the line chart with your actual figures and update the table on the right with corresponding values. Modify the legend labels (Series 1, 2, 3) to reflect your comparison categories, and adjust the title and axis labels. Colors can remain as designed or be customized to match your corporate branding.
-
Recommended For
Executives, marketing managers, business development teams, consultants, and investor relations professionals. Ideal for quarterly performance comparisons, market share trends, technology adoption rates, customer satisfaction metrics, and competitive benchmarking presentations.
-
Slide Structure
Left side: line chart with X-axis (2010–2025), Y-axis (0–25), three data series with four data points each. Right side: eight-row, three-column data table with headers (Visual trends, Text title, Text title). Title area and legend at top. 16:9 aspect ratio, two-slide set.
Related Products
-

Business Strategy Analysis with Line Chart
#Business Strategy #Market and Competitor Analysis #Diagram
-

Brown Blue Detailed Analysis Chart - Market and Competitor Analysis
#Market and Competitor Analysis #Diagram #Graph
-

Current Status Graph Analysis and Forecast – Market and Competitor Analysis
#Market and Competitor Analysis #Graph #Future Outlook
-

Company Financial Status Analysis Chart – Vision for Business Growth
#Business Introduction #Market and Competitor Analysis #Diagram
