Sales Ratio of Storage Furniture by Use – Market Status Analysis
RJ0900029_8
- Last Update 08/25/2025
- File Size 1.2MB
- # of Slides 2
- File Format PPTX
- Slide Ratio 16:9
- Color
Keywords
- #Content-Based Slides
- #Design-Based Slides
- #Market and Competitor Analysis
- #Financial Plans and Performance
- #Graph
- #Market Status
- #Sales and Revenue
- #Circles
- #Doughnut Chart
- #16:9
- #donut pie chart PowerPoint
- #sales ratio presentation slide
- #market analysis graph template
- #3-segment pie chart
- #data visualization PowerPoint slide
About the Product
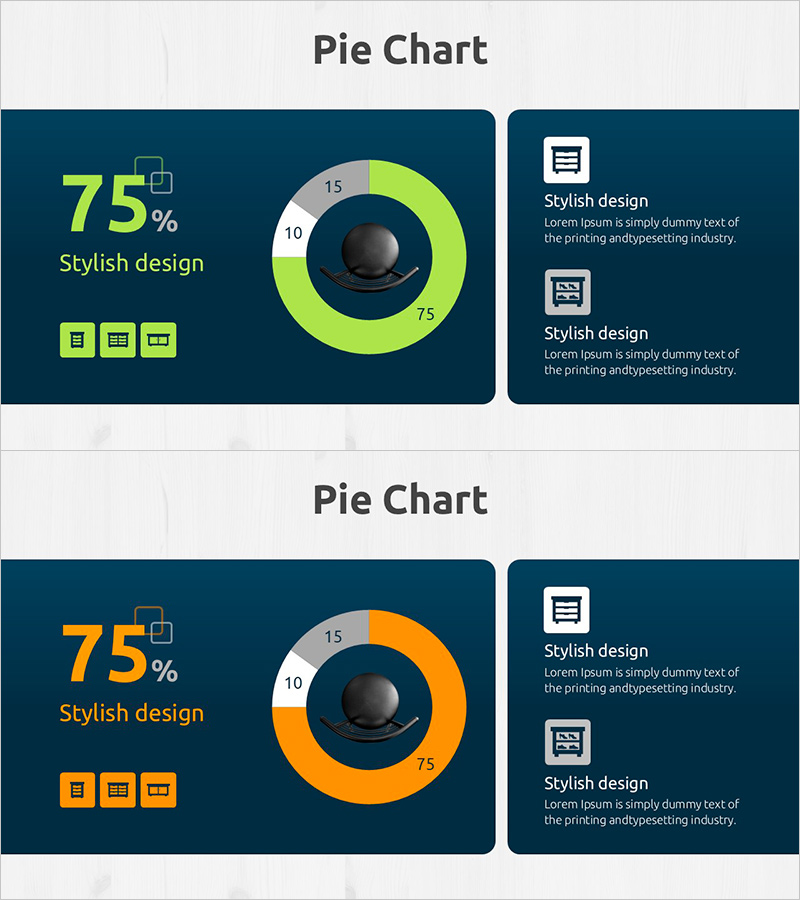
A donut-shaped pie chart PowerPoint slide designed to visualize sales ratios by product category or market segment. Set against a dark navy background, the three-segment donut graph uses lime green and orange accent colors to highlight key data points with immediate visual impact. The left side features a large percentage figure with descriptive text, while the right side displays icon-based information boxes for detailed explanations. This 2-slide template is optimized for market analysis presentations and business reports. The 16:9 widescreen format ensures compatibility with modern presentation environments, and color variations between slides enable flexible data representation.
Usage Points
-
Main Usage
Effectively communicates product sales composition, market share distribution, or category-based revenue breakdown. The donut chart's central circular area highlights the primary metric, while the large percentage display on the left emphasizes the most critical data point for immediate audience comprehension.
-
How to Use
Deploy in market analysis presentations, quarterly business reports, and product launch meetings to explain sales composition or market distribution data. Input category names in the left text area and add segment descriptions in the right information boxes. Use the two-slide color variations to represent different data sets or comparison scenarios.
-
Recommended For
Marketing managers, sales directors, and business planning teams presenting sales performance or market analysis to executives and stakeholders. Particularly effective in retail, distribution, and manufacturing sectors when explaining product category sales proportions or market segment breakdowns.
-
Slide Structure
Two slides with identical layout structure. Left section contains large percentage figure (75%) with label and three icon elements. Center features a three-segment donut pie chart in navy, lime, and orange (or navy and orange two-tone), with specific numerical values displayed in the center circle. Right section includes two information boxes with icons and descriptive text. 16:9 widescreen format throughout.
Related Products
-

Building Analysis Chart – Visualizing Market Status and Performance
#Market and Competitor Analysis #Financial Plans and Performance #Graph
-

Newspaper Wide PowerPoint Template Line Chart - Market Analysis and Revenue Performance
#Market and Competitor Analysis #Financial Plans and Performance #Graph
-

Donut Chart Slide for Interior Demand Survey
#Market and Competitor Analysis #Financial Plans and Performance #Graph
-

Visualize Coffee Sales Status with Donut Chart – Market Analysis
#Market and Competitor Analysis #Financial Plans and Performance #Graph
