Simple & Modern Wide PowerPoint Vertical Bar Chart
RJ0200058_25
- Last Update 04/15/2025
- File Size 0.1MB
- # of Slides 2
- File Format PPTX
- Slide Ratio 16:9
- Color
Keywords
- #Content-Based Slides
- #Design-Based Slides
- #Market and Competitor Analysis
- #Financial Plans and Performance
- #Graph
- #Market Status
- #Sales and Revenue
- #Column
- #Column Chart
- #16:9
- #vertical bar chart PowerPoint
- #bar graph slide template
- #data comparison chart
- #business analytics slide
- #5-item data visualization PowerPoint
About the Product
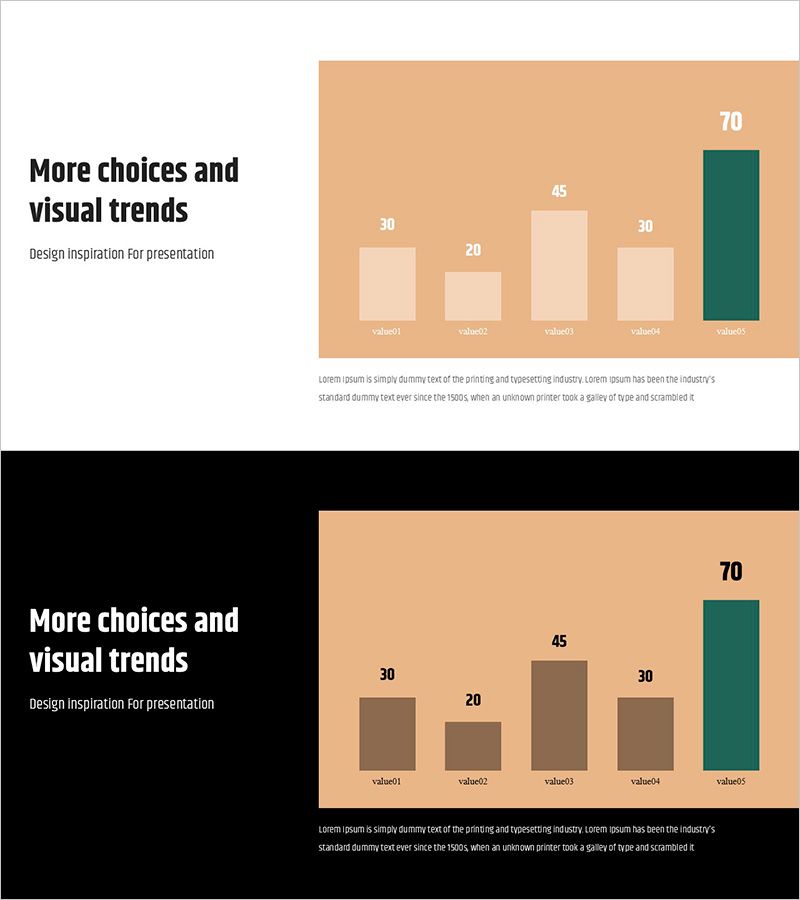
A vertical bar chart PowerPoint slide designed for business data visualization and comparative analysis. The slide features a beige background with five data items represented as vertical bars, with the final bar highlighted in dark teal to emphasize the highest value. Numeric labels (20, 30, 45, 30, 70) appear above each bar for precise data communication. This presentation slide is ready to use in financial reports, market analysis presentations, sales performance reviews, and any business context requiring quantitative comparison and trend visualization.
Usage Points
-
Main Usage
Visually compare five data items using bar height and emphasize the highest value through color contrast. This data visualization slide is optimized for quantitative comparisons such as sales figures, market share percentages, growth rates, and cost breakdowns across multiple categories.
-
How to Use
Apply this slide to quarterly financial performance comparisons in investor reports, competitive analysis in market research sections, channel performance metrics in marketing plans, and revenue projections in business proposals. Double-click each bar to edit values directly with your actual data.
-
Recommended For
Finance professionals, executives, marketing teams, and sales managers presenting at board meetings, investor briefings, quarterly reviews, and strategic planning sessions. Ideal for situations requiring comparison of five or fewer data categories with clear visual hierarchy.
-
Slide Structure
Two-slide layout: Slide 1 features the vertical bar chart with beige background (value01 through value05), Slide 2 presents the same chart with a black background variant. Each bar is independently adjustable for height, and the color palette consists of four beige tones plus one dark teal accent color for emphasis.
Related Products
-

Key Growth Drivers KPI Slide – Revenue, Efficiency, Customers
#Market and Competitor Analysis #Financial Plans and Performance #Graph
-

AI VC Market Statistics PowerPoint Slide – Bar Chart and KPI
#Market and Competitor Analysis #Financial Plans and Performance #Graph
-

Basic Vertical Bar Chart Slide – Market Status Analysis
#Market and Competitor Analysis #Financial Plans and Performance #Graph
-

Purple Green Flower Market Analysis – Market Status and Competitive Analysis
#Market and Competitor Analysis #Financial Plans and Performance #Graph
