Bar Chart Visualizing Yacht Tour Satisfaction
RJ0600106_15
- Last Update 07/19/2025
- File Size 7.7MB
- # of Slides 2
- File Format PPTX
- Slide Ratio 16:9
- Color
Keywords
- #Content-Based Slides
- #Design-Based Slides
- #Market and Competitor Analysis
- #Graph
- #Other
- #Market Status
- #Competitive Advantage
- #Column
- #Column Chart
- #Mockup
- #16:9
- #yacht tour satisfaction chart
- #vertical bar chart PowerPoint
- #mobile mockup presentation
- #customer satisfaction survey slide
- #travel industry data visualization
- #tourism satisfaction graph
About the Product
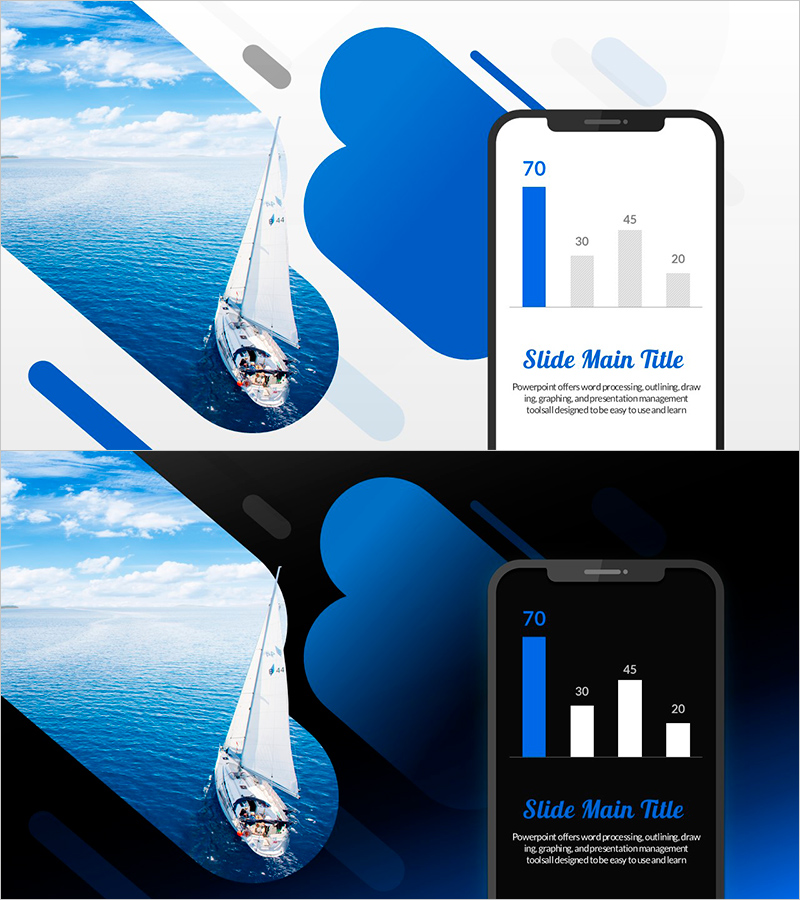
A vertical bar chart PowerPoint slide visualizing customer satisfaction for summer yacht tours. Featuring a bright sky-blue background with a primary blue bar and gray comparison bars clearly expressing data across four items. The mobile device mockup design displays the chart on a smartphone screen, making it ideal for digital reports and app-based analytics presentations. The 2-slide set includes both light and dark background versions to accommodate various presentation environments. This presentation material is ready for immediate use in customer satisfaction analysis, market research presentations, and tourism industry reports.
Usage Points
-
Main Usage
Visualizes customer satisfaction survey results quantitatively in the tourism and travel service industry, representing data collection and analysis processes through mobile apps and digital platforms. Effectively communicates customer feedback for premium travel products such as yacht tours, cruises, and resort experiences.
-
How to Use
Insert into the market analysis or customer satisfaction section of presentation materials to enable at-a-glance comparison of survey results. The mobile mockup design emphasizes digital-based data collection methods. Use the light background version for daytime presentations and the dark background version for evening presentations or dark-themed materials. Modify bar heights and colors to repurpose for different satisfaction metrics or competitor comparisons.
-
Recommended For
Tourism board executives, travel agency managers, resort management teams, marketing and customer satisfaction professionals, service quality improvement project teams, investor report writers, and academic presenters in tourism and service management fields. Recommended for all tourism and travel-related organizations requiring customer feedback-based decision-making.
-
Slide Structure
2-slide set presenting the same chart in both light background (white background, blue primary bar, gray comparison bar) and dark background (black background, blue primary bar, white comparison bar) versions. Each slide features a mobile device mockup centered on the canvas, enhanced with yacht imagery and abstract shapes for visual context. Four vertical bars represent four data items (70, 45, 30, 20), optimized for widescreen 16:9 presentation format.
Related Products
-

Backpack Travel Vertical Bar Graph – Market Status and Competitive Advantage
#Market and Competitor Analysis #Graph #Market Status
-

Infographic Design Wide Template Chart2 for Market Analysis
#Market and Competitor Analysis #Graph #Market Status
-

Weather Bar Graph - Market Status Analysis
#Market and Competitor Analysis #Graph #Market Status
-

3D Bar Graph for Market Performance Analysis – Slide Highlighting Competitive Edge
#Market and Competitor Analysis #Graph #Market Status
