Sea Lighthouse Goal Market Strategy Line Graph – Revenue and Profit Growth
RJ0600079_20
- Last Update 07/11/2025
- File Size 33.7MB
- # of Slides 2
- File Format PPTX
- Slide Ratio 16:9
- Color
Keywords
- #Content-Based Slides
- #Design-Based Slides
- #Market and Competitor Analysis
- #Financial Plans and Performance
- #Graph
- #Market Status
- #Sales and Revenue
- #Line
- #Line Chart
- #16:9
- #line chart PowerPoint
- #dual-series chart template
- #revenue trend slide
- #profit analysis graph
- #line graph PowerPoint download
- #data visualization slide
About the Product
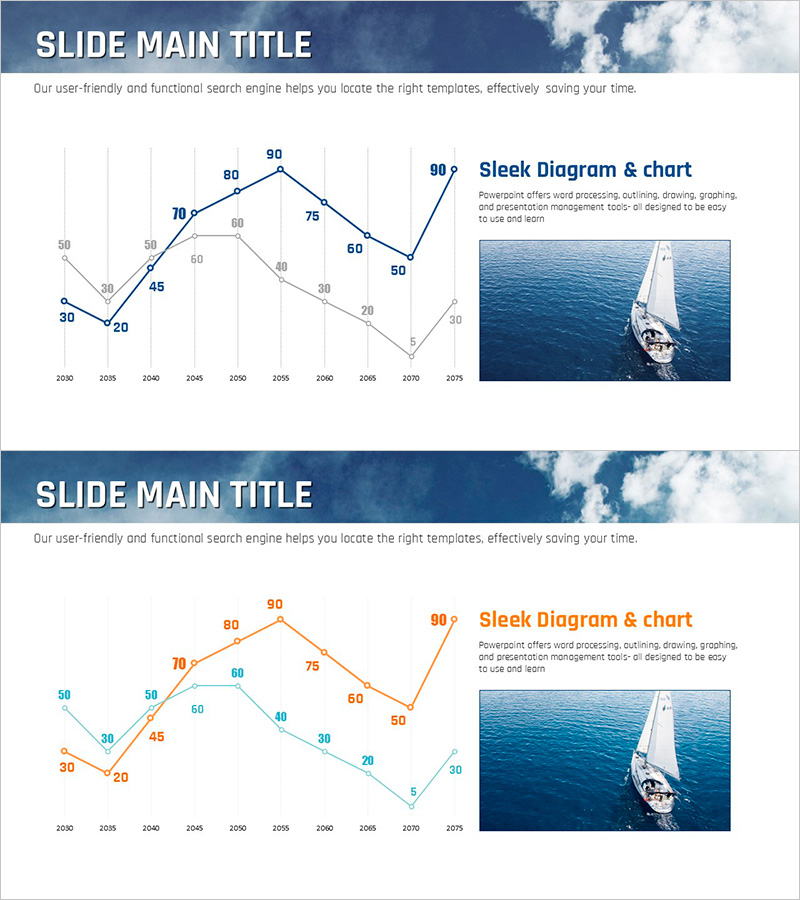
A line chart PowerPoint slide visualizing two data series side by side. Blue and orange lines represent revenue and profit trends from 2030 to 2075, with labeled data points and gridlines for precise value reading. This presentation slide is ready to use in business reports, financial analyses, and strategic briefings. The 16:9 widescreen format with 2-slide composition adapts to various presentation environments and supports immediate customization.
Usage Points
-
Main Usage
Ideal for comparing two or more numerical data trends over time. Visualizes comparative relationships such as revenue vs. profit, budget vs. actual, or plan vs. achievement, providing clear evidence for strategic decision-making and performance analysis.
-
How to Use
Apply to financial report sections, quarterly and annual earnings presentations, marketing performance comparisons, strategic meeting materials, and investor briefings. Edit data points and line colors to match your specific comparison scenarios and organizational metrics.
-
Recommended For
Finance teams presenting quarterly and annual results, sales departments analyzing revenue trends, executive briefings on business performance, investor presentations demonstrating growth potential, and consulting firms preparing benchmarking analyses.
-
Slide Structure
Two data series (blue and orange lines) plotted against a time axis (2030–2075) and numerical axis (0–90). Each data point displays its value label, and gridlines enable precise value identification. A legend and title area establish clear information hierarchy and context.
Related Products
-

Visualizing Sales and Meeting Progress Over Time
#Market and Competitor Analysis #Financial Plans and Performance #Graph
-

Fashion Market Sales Status Graph – Data Visualization and Trend Analysis
#Market and Competitor Analysis #Financial Plans and Performance #Graph
-

Highlighted Curved Graph for Market Analysis
#Market and Competitor Analysis #Financial Plans and Performance #Graph
-

Newspaper Wide PowerPoint Template Line Chart - Market Analysis and Revenue Performance
#Market and Competitor Analysis #Financial Plans and Performance #Graph
