Botanic Garden and Bar Chart – Visualization for Market Analysis
RJ0600097_8
- Last Update 07/17/2025
- File Size 7.6MB
- # of Slides 2
- File Format PPTX
- Slide Ratio 16:9
- Color
Keywords
- #Content-Based Slides
- #Design-Based Slides
- #Market and Competitor Analysis
- #Diagram
- #Graph
- #Other
- #Market Analysis
- #Cluster
- #Closed Cluster Diagram
- #16:9
- #horizontal bar chart PowerPoint
- #market analysis presentation slide
- #competitive analysis chart
- #data comparison PowerPoint template
- #business graph slide design
About the Product
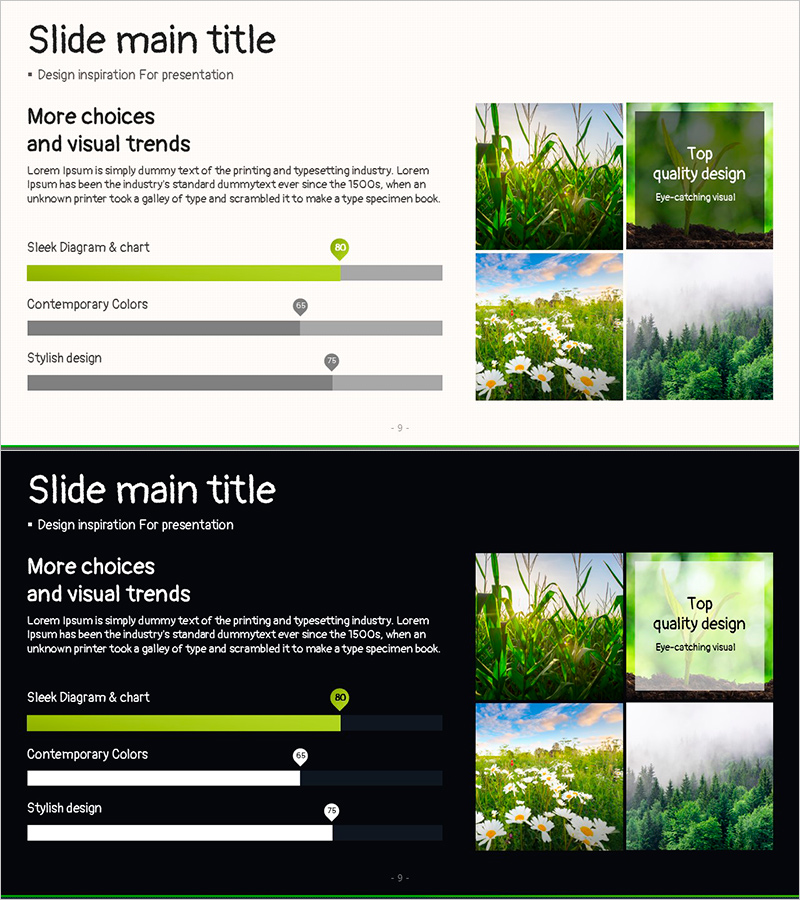
A professional PowerPoint slide set designed for market analysis and competitive comparison. This 2-slide presentation combines horizontal bar charts with botanical imagery in a lime-green and gray color scheme. The first slide features a light background with three-item bar chart data visualization alongside four nature photography images arranged in a grid. The second slide presents the same chart structure against a black background, creating visual contrast and emphasis. Ideal for presenting quantitative data, market share, competitive positioning, and performance metrics in business presentations.
Usage Points
-
Main Usage
Clearly compare and visualize quantitative data across multiple categories. The three-item horizontal bar structure enables quick assessment of rankings, market size, growth rates, and performance metrics. Suitable for presenting sales figures, market share, customer satisfaction scores, and competitive benchmarks.
-
How to Use
Use the light-background slide during presentation opening to introduce data context. Deploy the dark-background slide when emphasizing critical findings or conclusions. Edit bar values directly to input your actual data. Replace botanical images with industry-specific or brand-aligned photography as needed. All elements are fully editable in PowerPoint.
-
Recommended For
Executive reports, marketing strategy presentations, investor pitch decks, and business analysis documents. Particularly valuable for marketing professionals, business strategists, sales teams, and product managers presenting market research, competitive analysis, sales performance, and customer segmentation data.
-
Slide Structure
2-slide set in 16:9 widescreen format (PPTX). Slide 1: Light background with lime-green accent bar, three-item horizontal bar chart, and four-image botanical grid on right. Slide 2: Black background with identical chart structure and botanical imagery. All text, numbers, colors, and images are fully editable.
Related Products
-

Price Quality Positioning Map – Market and Competitor Analysis
#Market and Competitor Analysis #Marketing Plan and Strategy #Diagram
-

Space Industry Positioning Diagram – Market Analysis and Strategy
#Market and Competitor Analysis #Marketing Plan and Strategy #Diagram
-

Investment Competition Market Analysis Graph – Effective Market Evaluation
#Market and Competitor Analysis #Diagram #Graph
-

Positioning Map – Market Analysis and Strategy
#Market and Competitor Analysis #Marketing Plan and Strategy #Diagram
