Travel Icon Pie Chart Slide - Essential for Market Analysis
RJ0600030_6
- Last Update 06/28/2025
- File Size 1.3MB
- # of Slides 2
- File Format PPTX
- Slide Ratio 16:9
- Color
Keywords
About the Product
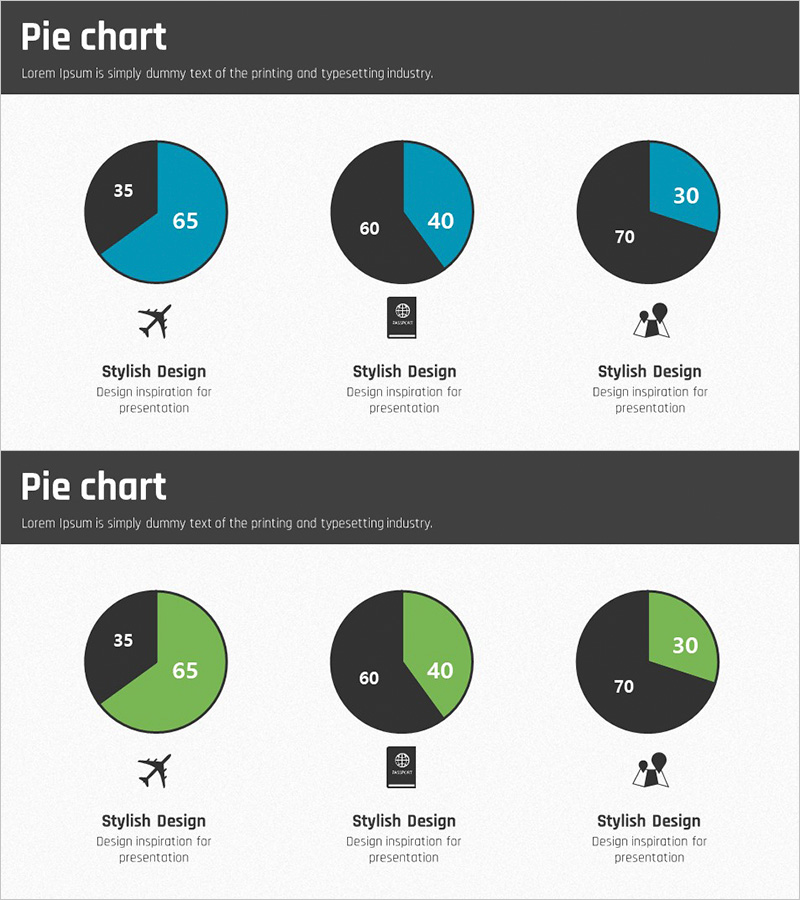
A PowerPoint pie chart slide designed for travel industry market analysis presentations. The slide features three circular pie charts on a dark gray background, each with two segments displayed in teal and lime green colors. Travel-related icons—airplane, luggage, and people—are positioned below each chart for visual context. The 2-slide set enables intuitive representation of market share, customer distribution, and competitive analysis data. Provided in 16:9 widescreen PPTX format for immediate use in travel business presentations.
Usage Points
-
Main Usage
Optimized for visualizing market share, customer distribution, and competitive comparison data in the travel, tourism, airline, and hospitality sectors. Enables ratio-based data communication in business presentations and market analysis reports.
-
How to Use
Replace the travel icons below each pie chart with category-specific icons (flights, accommodations, tours). Edit the chart values with actual data and adjust colors to match corporate branding. Insert into the market analysis or competitive analysis section of your presentation.
-
Recommended For
Ideal for travel agencies, airlines, hotels, and tour operators preparing business plans, investor pitch decks, marketing proposals, and quarterly performance reports. Recommended for market research teams, marketing departments, and executive presentations.
-
Slide Structure
Two-slide set with three pie charts per slide. Each chart is divided into two segments using teal and lime green colors on a dark gray background. Travel icons (airplane, luggage, people) are positioned below each chart for category identification and visual appeal.
Related Products
-

Market Analysis by Year Pie Chart – Emphasizing Market Share
#Market and Competitor Analysis #Graph #Market Share
-

Market Analysis Report Visualized with Pie Chart
#Market and Competitor Analysis #Diagram #Graph
-

Detailed Analysis Pie Chart – Market Share and Promising Competitors
#Market and Competitor Analysis #Graph #Market Share
-

Market Share Circle Graph – Ideal for Market Analysis
#Market and Competitor Analysis #Graph #Market Share
