Market Share Visualization of Three Countries – Effective Data Analysis
RJ0900008_10
- Last Update 08/17/2025
- File Size 0.7MB
- # of Slides 2
- File Format PPTX
- Slide Ratio 16:9
- Color
Keywords
About the Product
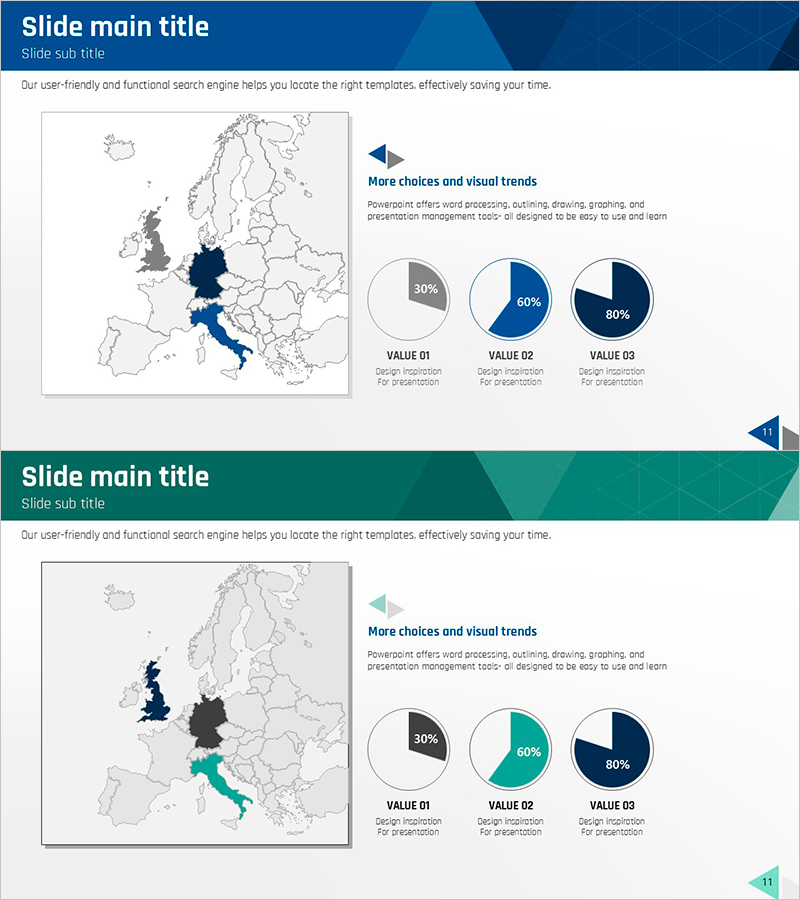
A 2-slide PowerPoint presentation combining a European map with pie charts for market share visualization. The first slide features a light gray Europe map with Italy and the UK highlighted in dark blue, accompanied by three pie charts on the right (30%, 60%, 80%) representing market share by country. The second slide repeats the same layout in a teal color tone, offering a color variation option. This map-based data visualization effectively communicates regional market conditions and is ready for immediate use in presentations and reports.
Usage Points
-
Main Usage
Visualize regional and country-level market share, sales volume, and customer distribution using both map and pie chart formats simultaneously, enabling effective communication of international market analysis and regional performance comparisons.
-
How to Use
Highlight the countries to emphasize on the map using color coding, then input corresponding numerical data into the pie charts on the right. Select the color tone (dark blue or teal) that matches your presentation theme and brand guidelines.
-
Recommended For
International business strategy presentations, global market analysis reports, regional sales performance briefings, investment pitch decks, and marketing performance analysis presentations.
-
Slide Structure
2-slide layout. Each slide features a light gray Europe map on the left with two countries highlighted in color and others in gray, paired with three pie charts on the right (showing 30%, 60%, 80% proportions), with color variation versions provided.
Related Products
-

Pie Chart of Camping Business Market Share by European Country
#Market and Competitor Analysis #Graph #Other
-

Market Share and Analysis Graph – Blue, Orange, Green
#Market and Competitor Analysis #Graph #Market Share
-

Market Analysis and Market Share Pie Chart – Capturing Success Through Data Visualization
#Market and Competitor Analysis #Diagram #Graph
-

Focus Chart of Subject Proportions – Visualizing Market Share
#Market and Competitor Analysis #Graph #Market Share
