Travel Plan – Colorful Donut Graph
RJ0600100_12
- Last Update 08/28/2025
- File Size 0.7MB
- # of Slides 2
- File Format PPTX
- Slide Ratio 16:9
- Color
Keywords
About the Product
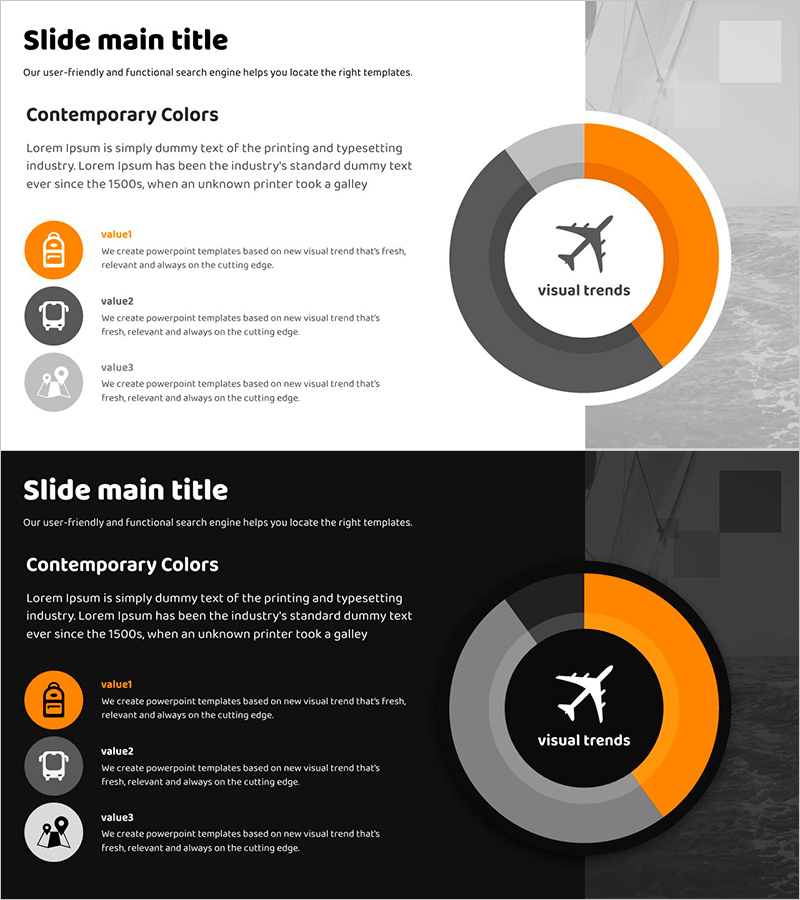
A 3-segment donut chart PowerPoint slide designed to visualize travel schedules and itinerary planning. Featuring a contemporary color palette of orange, gray, and white, this slide combines a central airplane icon with a circular chart to intuitively represent data proportions. Provided in 2-slide format with 16:9 widescreen aspect ratio, each slide balances background imagery with text areas for polished presentation delivery. Instantly applicable to travel agencies, tourism planning, project management, business reports, and various presentation scenarios requiring proportion visualization.
Usage Points
-
Main Usage
Represents three data categories—travel itinerary, transportation modes, and budget allocation—through a donut chart format, enabling audiences to instantly grasp data composition. The central airplane icon reinforces the travel theme, while clearly segmented sections maximize information delivery efficiency.
-
How to Use
Input travel schedule, transportation, and budget data into the three chart segments with corresponding numerical values. Pre-arranged background imagery and text areas allow immediate customization by editing content only. Color adjustments and icon replacements are easily performed.
-
Recommended For
Ideal for travel agencies, tourism planning teams, project managers, business planners, and marketing professionals presenting travel products, project progress, or budget allocation. Particularly effective for business reports, proposals, and educational materials requiring proportion comparisons.
-
Slide Structure
2-slide format (16:9 widescreen) with 3-segment donut chart as focal point. First slide features light background with orange-gray-white donut chart and central airplane icon; second slide uses dark background with identical chart structure for contrast variation. Text input areas are designated for each segment.
Related Products
-

Sales Growth Analysis Chart by Sector – A Tool for Understanding Business Status
#Product/Service Introduction #Business Management #Diagram
-

Detailed Analysis Circle Graph Presentation Template
#Product/Service Introduction #Market and Competitor Analysis #Graph
-

Development Status Analysis Graph – Visualizing Market Share
#Product/Service Introduction #Market and Competitor Analysis #Graph
-

Shopping Status Analysis Graph – Effective Data Presentation
#Product/Service Introduction #Graph #Composition
