Meat Positioning Map – Market and Consumer Analysis
RJ0800042_20
- Last Update 08/12/2025
- File Size 0.5MB
- # of Slides 2
- File Format PPTX
- Slide Ratio 16:9
- Color
Keywords
- #Content-Based Slides
- #Design-Based Slides
- #Product/Service Introduction
- #Marketing Plan and Strategy
- #Graph
- #Other
- #Features
- #Positioning
- #16:9
- #positioning map PowerPoint slide
- #2-axis analysis chart
- #performance pricing matrix
- #competitive positioning PPT
- #how to create a positioning map in PowerPoint
About the Product
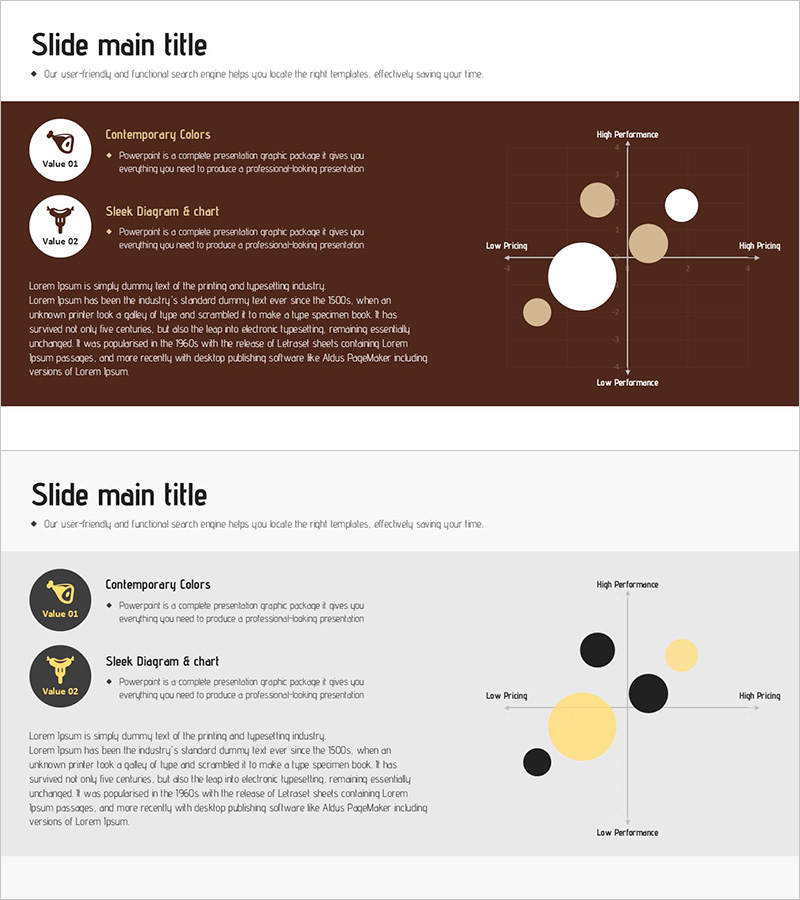
A positioning map PowerPoint slide for market and consumer analysis. This 2-slide deck features a brown background with icons and bubble chart visualization, displaying product positioning across performance and pricing dimensions. The left side lists Value 01 and Value 02 with descriptive text, while the right side shows a 2×2 matrix with High Performance, Low Pricing, High Pricing, and Low Performance axes. Bubble positions represent competitive landscape and product placement. Ideal for marketing strategy presentations, product launches, and competitive analysis in pitch decks and business proposals.
Usage Points
-
Main Usage
Visualize product positioning relative to competitors using a two-dimensional performance-pricing matrix. Communicate competitive differentiation and market strategy to investors, partners, and internal stakeholders with clear data-driven positioning.
-
How to Use
Enter your product's two core value propositions in the left Value fields. Plot your product and competitor positions as bubbles on the 2×2 matrix. Customize axis labels (High/Low Performance, High/Low Pricing) to match your market analysis context and presentation narrative.
-
Recommended For
Marketing managers, product strategists, and sales executives presenting product positioning and competitive analysis. Suitable for business plans, pitch decks, investment proposals, and marketing strategy documents.
-
Slide Structure
Slide 1: Title + descriptive bullet point + two Value icons with text labels + 2×2 positioning matrix with 4-6 editable bubble data points. Slide 2: Alternate color scheme (gray, black, beige bubbles) for design flexibility. Two text input areas and fully customizable chart elements.
Related Products
-

Clothing Market Positioning Map – Strategic Analysis
#Market and Competitor Analysis #Marketing Plan and Strategy #Diagram
-

Price Quality Positioning Map – Market and Competitor Analysis
#Market and Competitor Analysis #Marketing Plan and Strategy #Diagram
-

Blue Orange Positioning Slide - Data Visualization and Marketing Strategy
#Marketing Plan and Strategy #Graph #Other
-

Positioning Map – Market Analysis and Strategy
#Market and Competitor Analysis #Marketing Plan and Strategy #Diagram
