Market Share Analysis with Pie Chart – Precise Data Visualization
RJ0500023_17
- Last Update 06/13/2025
- File Size 0.5MB
- # of Slides 2
- File Format PPTX
- Slide Ratio 16:9
- Color
Keywords
- #Content-Based Slides
- #Design-Based Slides
- #Company Introduction
- #Market and Competitor Analysis
- #Graph
- #Shareholder Structure
- #Market Share
- #Circles
- #Pie Chart
- #16:9
- #pie chart PowerPoint slide
- #pie graph presentation template
- #market share visualization
- #ratio analysis slide
- #data visualization PowerPoint
- #4-segment pie chart template
About the Product
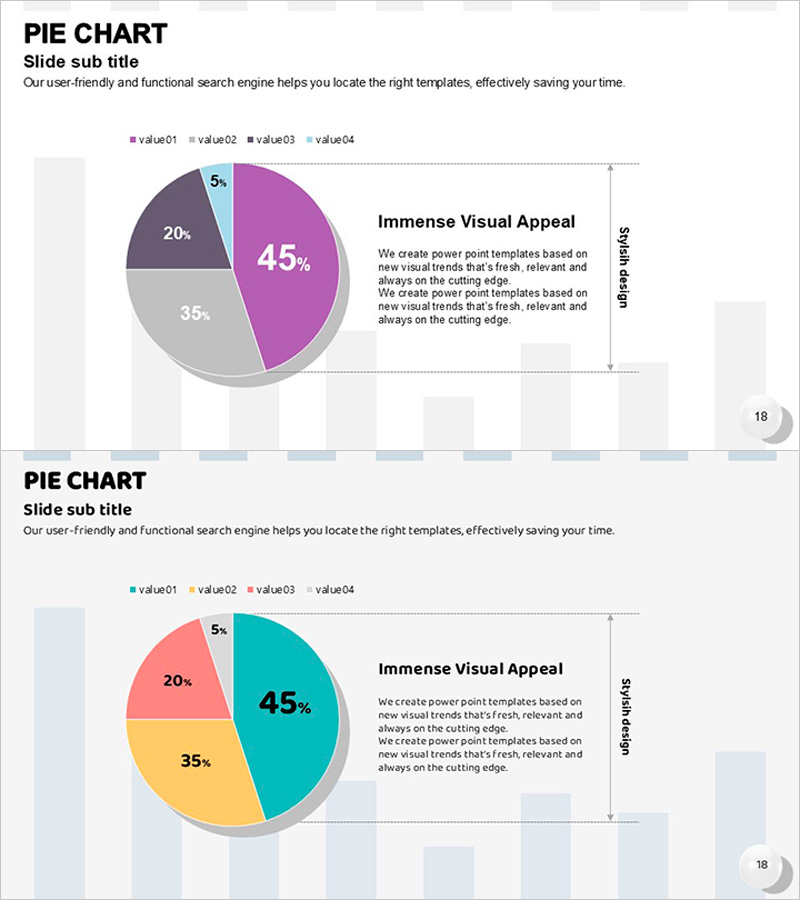
A PowerPoint slide template featuring a 4-segment pie chart for visualizing market share, revenue composition, customer distribution, and other proportional data. The chart uses four distinct colors—purple, teal, gray, and pink—to clearly differentiate each segment, with a text area on the right side for adding explanations and insights. The 2-slide set is optimized for 16:9 widescreen format and works seamlessly in business presentations, quarterly reports, and marketing analyses. Ready to edit and customize with your own data immediately.
Usage Points
-
Main Usage
Visualize proportional data using pie charts to help audiences instantly understand each segment's share of the whole. Ideal for presenting market share, revenue breakdown, customer demographics, budget allocation, and other part-to-whole relationships in executive reports and strategic presentations.
-
How to Use
Double-click the pie chart on each slide to edit the data values, and the percentages will automatically update. Use the legend and percentage labels to clearly identify each segment, then add your analysis or key insights in the text box on the right to complete your presentation.
-
Recommended For
Recommended for executive reports, quarterly earnings presentations, marketing analysis documents, investor pitch decks, and business plans. Ideal for finance, planning, marketing, and sales professionals who need to emphasize compositional ratios in their presentations.
-
Slide Structure
2-slide set. Each slide features a 4-segment pie chart (purple 45%, gray 35%, teal 20%, light blue 5%) with a text box on the right for additional content. Includes legend and percentage labels. Designed for 16:9 widescreen format.
Related Products
-

Simple Car Presentation Diagram & Pie Chart – Optimized for Market Analysis
#Market and Competitor Analysis #Diagram #Graph
-

Triangular Pattern Presentation Template Pie Chart – Market Analysis and Strategy
#Market and Competitor Analysis #Financial Plans and Performance #Diagram
-

Three Key Performance Pie Charts – Visualization of Performance Analysis
#Company Introduction #Market and Competitor Analysis #Graph
-

Modern Blue Pie Chart Template – Market Share Analysis
#Market and Competitor Analysis #Diagram #Graph
