Colorful Bell Graph Slide – Market Status Analysis
RJ0500008_4
- Last Update 06/09/2025
- File Size 3.1MB
- # of Slides 2
- File Format PPTX
- Slide Ratio 16:9
- Color
Keywords
About the Product
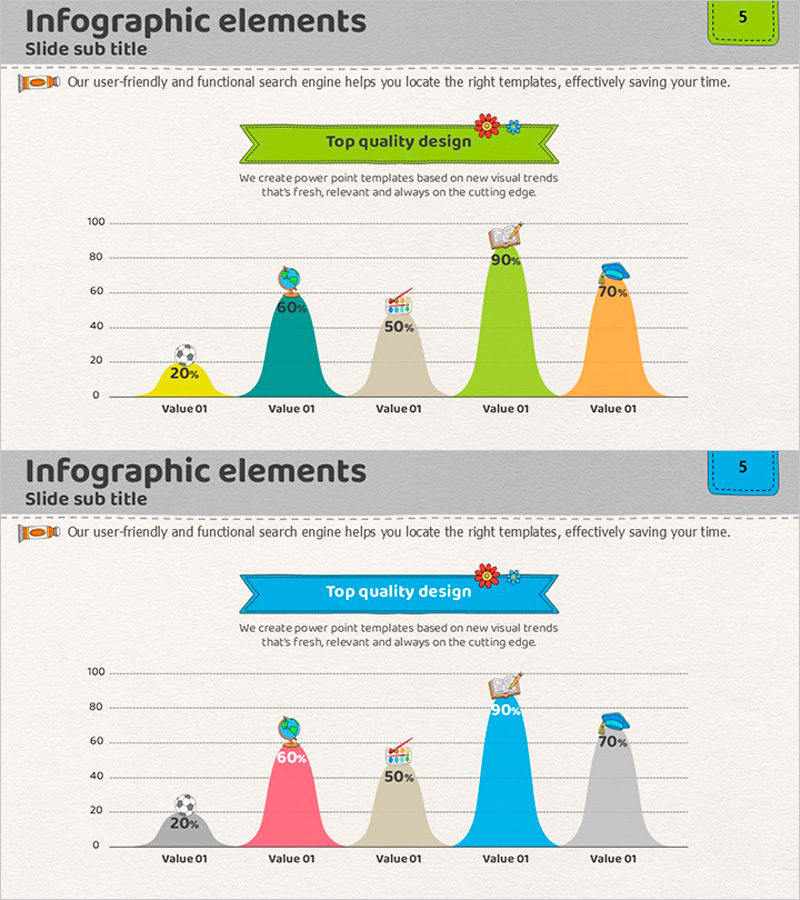
A PowerPoint slide template featuring a 5-series bell curve graph that visualizes data distribution trends across multiple data points. The design uses vibrant colors—lime green, teal, beige, orange, and gray—to represent each data series, making market analysis, customer satisfaction metrics, and performance distribution immediately clear. Each slide includes percentage values and decorative icons to reinforce data meaning, optimized for 16:9 widescreen format. Perfect for statistics sections in presentations, reports, and strategic proposals.
Usage Points
-
Main Usage
Displays distribution patterns of five data series using bell curve visualization, ideal for market analysis, customer satisfaction surveys, performance metrics, and competitive positioning. Each data series is color-coded for easy comparison and interpretation of statistical trends.
-
How to Use
Insert into reports, strategic plans, or analytical presentations in the statistics or findings section. Edit text labels and percentage values to match your actual data, and adjust colors to align with corporate branding. The 2-slide set allows multiple analytical perspectives.
-
Recommended For
Marketing reports, sales presentations, executive briefings, market research findings, product performance analysis, and competitive benchmarking. Ideal for strategy, analytics, and business intelligence professionals who need data-driven visual communication.
-
Slide Structure
2-slide template. Each slide contains 5 bell curves representing different data series in lime green, teal, beige, orange, and gray. A ribbon banner at the top highlights the title, with decorative icons for visual interest. Bottom labels show 'Value 01–05' with corresponding percentage values for clear data readability.
Related Products
-

Travel Preference Survey Slide – Market Status and Competitive Advantage
#Market and Competitor Analysis #Graph #Market Status
-

Line Graph for Market Trends Visualization – Competitive Advantage Analysis
#Market and Competitor Analysis #Graph #Market Status
-

Line Graph for Camping Market Analysis – Market Trends and Competitive Advantage
#Market and Competitor Analysis #Graph #Market Status
-

Work Stress Visualized with Line Chart – Analysis and Competitive Advantage
#Market and Competitor Analysis #Graph #Market Status
