Graph of Change in Number of Occurrences – Market Trends and Performance
RJ0800010_27
- Last Update 08/02/2025
- File Size 1MB
- # of Slides 2
- File Format PPTX
- Slide Ratio 16:9
- Color
Keywords
- #Content-Based Slides
- #Design-Based Slides
- #Business Strategy
- #Market and Competitor Analysis
- #Graph
- #Achievements
- #Industry Trends
- #Horizontal Bar
- #Segmented Horizontal Bar
- #16:9
- #horizontal bar chart PowerPoint
- #4-year trend slide
- #market trends presentation
- #performance comparison graph
- #data visualization slide
- #how to create bar chart in PowerPoint
About the Product
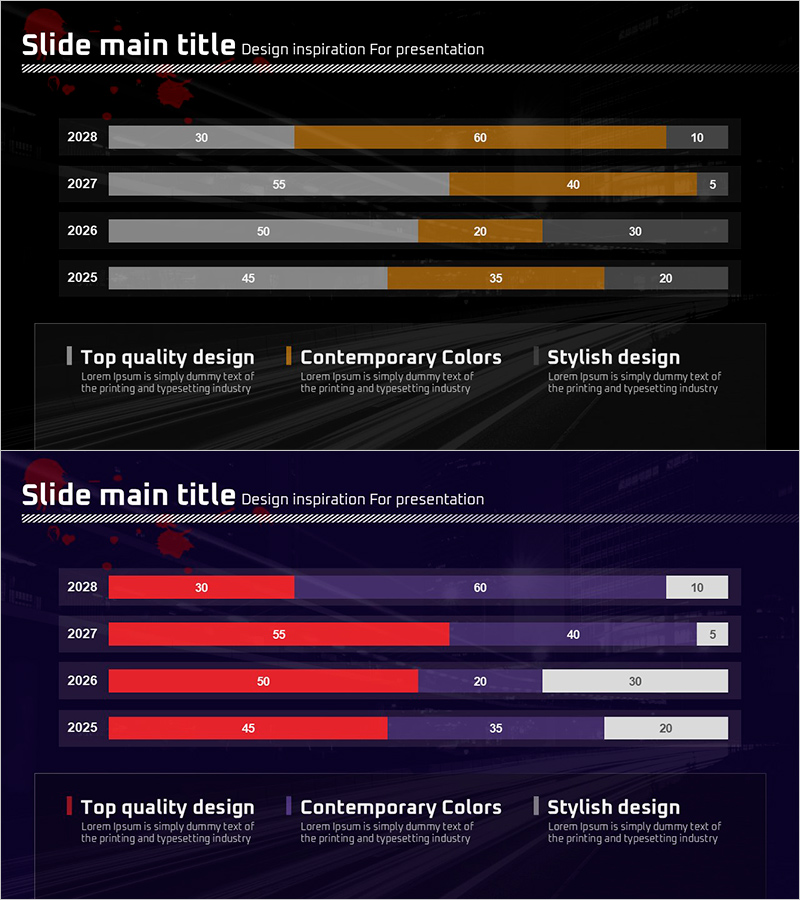
A horizontal bar chart PowerPoint slide comparing the change in number of occurrences across 4 years (2025–2028) with 3 distinct data series. The slide uses gray, orange, and white color coding to differentiate data categories, with numerical values clearly displayed for each year and series (30, 60, 10, etc.). Ideal for business performance presentations, market trend analysis, and strategic initiative reports. Provided in 16:9 PPTX format with fully editable data values, labels, and legend entries for immediate customization.
Usage Points
-
Main Usage
Visualize multi-series data trends over time, enabling side-by-side comparison of performance metrics across years. Ideal for executive presentations, quarterly and annual performance reports, market analysis briefings, and strategic business communications where numerical trends and comparative insights are critical.
-
How to Use
2-slide template: Slide 1 features a horizontal bar chart with 4 year rows (2025–2028) and 3 color-coded data series per row. Slide 2 includes a legend with 3 category labels and corresponding description text boxes. Edit the numerical values, year labels, and legend text to match your data and presentation context.
-
Recommended For
Executive leadership presenting quarterly/annual performance, marketing teams analyzing market trends, consulting and research firms delivering data-driven reports, investor relations teams explaining business metrics, and operations managers tracking multi-year KPIs.
-
Slide Structure
2-slide layout. Slide 1: Horizontal bar chart with 4 year rows (2025, 2027, 2026, 2025), each containing 3 stacked/grouped bars in gray, orange, and white with numeric labels. Slide 2: Legend section with 3 labeled items (Top quality design, Contemporary Colors, Stylish design) and corresponding descriptive text blocks below each legend entry.
Related Products
-

100% Stacked Column Chart Slide – Performance and Market Trends
#Business Strategy #Market and Competitor Analysis #Graph
-

Stacked Bar Graph for Growing Market Trends – Business Strategy
#Business Strategy #Market and Competitor Analysis #Graph
-

Sales Trends Over the Past Four Years - Graph for Market Analysis and Achievements
#Business Strategy #Market and Competitor Analysis #Graph
-

Horizontal Bar Chart for Annual Coffee Consumption – Business Strategy
#Business Strategy #Market and Competitor Analysis #Graph
