Analysis of Performers by Country - Horizontal Bar Chart Template
RJ0500020_17
- Last Update 06/12/2025
- File Size 0.6MB
- # of Slides 2
- File Format PPTX
- Slide Ratio 16:9
- Color
Keywords
- #Content-Based Slides
- #Design-Based Slides
- #Company Introduction
- #Business Management
- #Graph
- #Other
- #Global Network
- #Project Staffing
- #Horizontal Bar
- #Segmented Horizontal Bar
- #16:9
- #horizontal bar chart PowerPoint
- #regional data comparison slides
- #performance analysis template
- #bar graph presentation
- #international comparison chart
About the Product
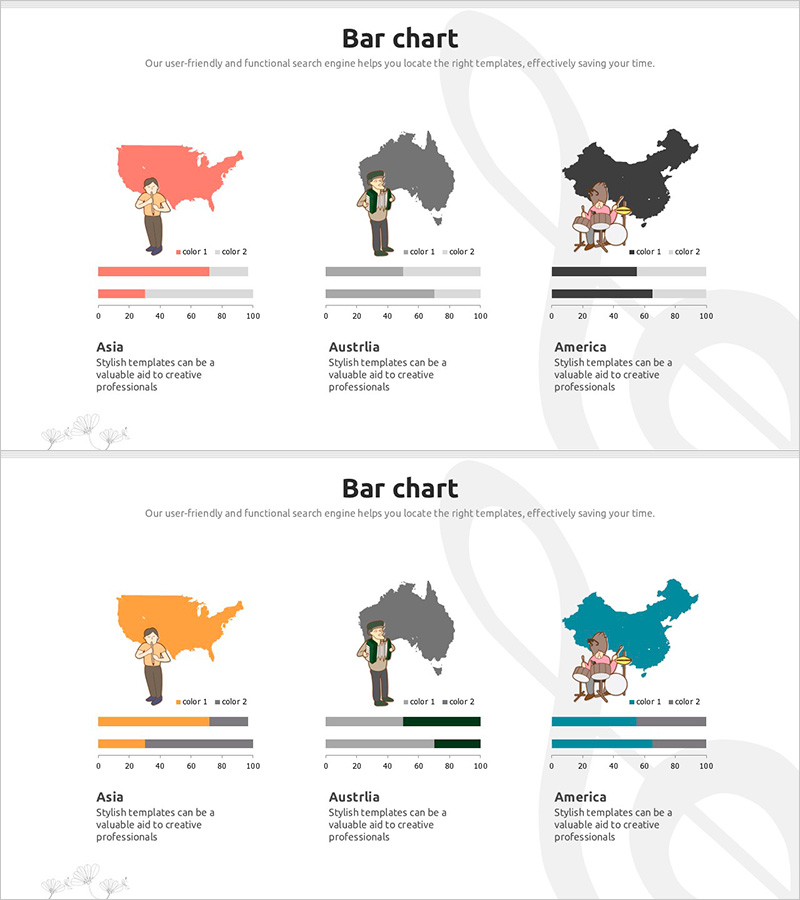
A horizontal bar chart PowerPoint slide that visually compares performance across three regions: Asia, Australia, and America. Each region displays two data series side by side, enabling simultaneous comparison of regional differences and item-by-item metrics. Multiple color combinations—including red, gray, black, orange, and teal—are provided for customization to match your presentation theme and corporate branding. Clear axis scaling from 0 to 100 ensures easy numerical interpretation, while character illustrations and map backgrounds make this template ideal for international business presentations. This 2-slide set is ready to use immediately in your presentation materials.
Usage Points
-
Main Usage
Display regional, country, or departmental performance metrics using horizontal bars to enable intuitive size comparison across items. Two data series differentiated by color allow simultaneous comparison of paired metrics within each region, such as target versus actual or year-over-year performance.
-
How to Use
Modify each regional bar length to input your actual data values. Update the legend color labels (color 1 and color 2) and replace region names and numerical values. Insert into your presentation slide as needed. Background map and character illustrations can be retained or removed based on your design preference.
-
Recommended For
International marketing and sales reports, regional performance analysis presentations, global business strategy meetings, quarterly or annual performance evaluation materials, and comparative analysis sections in consulting proposals.
-
Slide Structure
Each slide contains 3 regions (Asia, Australia, America) × 2 data series = 6 bar sets total. Horizontal axis scaled 0–100, region labels, legend (color 1 and color 2), background map, and character illustrations included. 2-slide set with color scheme variations: red-gray-black combination, orange-gray-black combination, and teal-gray-black combination.
Related Products
-

Global Market Entry & Data-Based Market Analysis Chart
#Company Introduction #Market and Competitor Analysis #Graph
-

Space Exploration Themed Global Map – Global Market Strategy
#Company Introduction #Marketing Plan and Strategy #Other
-

Market Outlook Segmentation Analysis Graph – Strengthening Business Strategy
#Company Introduction #Market and Competitor Analysis #Diagram
-

Detailed Location Map & Occupancy Graph – Market Share and Global Network
#Company Introduction #Market and Competitor Analysis #Graph
