Business Objectives & Segmentation Graph – Visualizing Business Vision
RJ0700027_10
- Last Update 07/29/2025
- File Size 0.3MB
- # of Slides 2
- File Format PPTX
- Slide Ratio 16:9
- Color
Keywords
About the Product
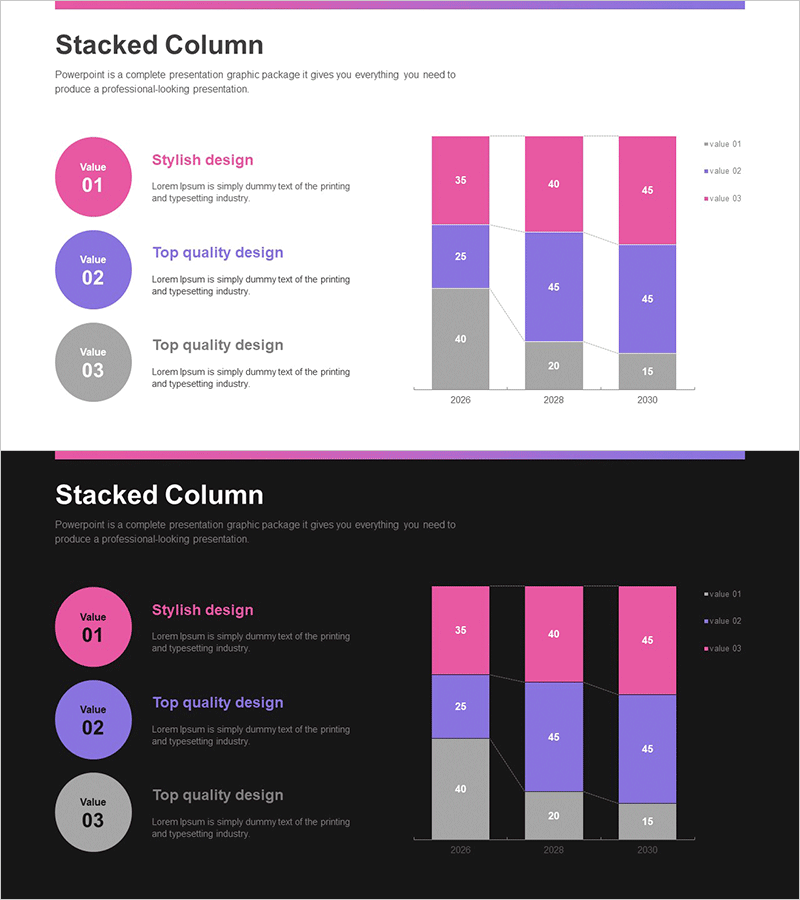
This PowerPoint slide effectively visualizes business objectives and market segmentation using a vertical bar graph. Constructed with a modern and stylish design, the purple, white, and black color combination enhances sophistication. This slide provides practical data on market trends and objectives by year, making it an excellent visual resource for strategy formulation and presentations. It is a superb choice for internal reports, investment proposals, or strategic presentations.
Usage Points
-
Main Usage
- This template serves as a valuable tool for professionals who need to present detailed analyses of market trends and business objectives during strategic meetings or investment discussions.
-
How to Use
- Utilize this slide during internal team meetings to facilitate discussions around performance metrics and future strategies, or in client presentations to clearly communicate market positioning and growth opportunities.
-
Recommended For
- Ideal for business analysts, project managers, and marketing professionals who are tasked with presenting data-driven insights to stakeholders or upper management.
-
Slide Structure
- The presentation is organized to guide the audience through a logical flow, starting with an overview of market segmentation, followed by annual objectives illustrated with data visualizations, and concluding with actionable insights derived from the analysis.
Related Products
-

Business Goal Analysis Graph – Realizing Business Vision
#Business Vision and Strategy #Market and Competitor Analysis #Diagram
-

Current Trends and Issues Chart – Simplifying Market Analysis
#Market and Competitor Analysis #Graph #Market Analysis
-

Bundled Charts by Category – Market and Competitor Analysis
#Market and Competitor Analysis #Graph #Market Analysis
-

Market Analysis Graph by Year – Effective Tool for Competitor Analysis
#Market and Competitor Analysis #Graph #Competitor Analysis
