Donut Chart Visualizing Progress of Space Industry by Country
RJ0700003_19
- Last Update 07/22/2025
- File Size 0.8MB
- # of Slides 2
- File Format PPTX
- Slide Ratio 16:9
- Color
Keywords
- #Content-Based Slides
- #Design-Based Slides
- #Company Introduction
- #Market and Competitor Analysis
- #Graph
- #Other
- #Global Network
- #Target Market
- #Circles
- #Doughnut Chart
- #16:9
- #world map donut chart PowerPoint
- #regional data visualization slide
- #global market share presentation
- #pie chart by region
- #how to create donut chart in PowerPoint
About the Product
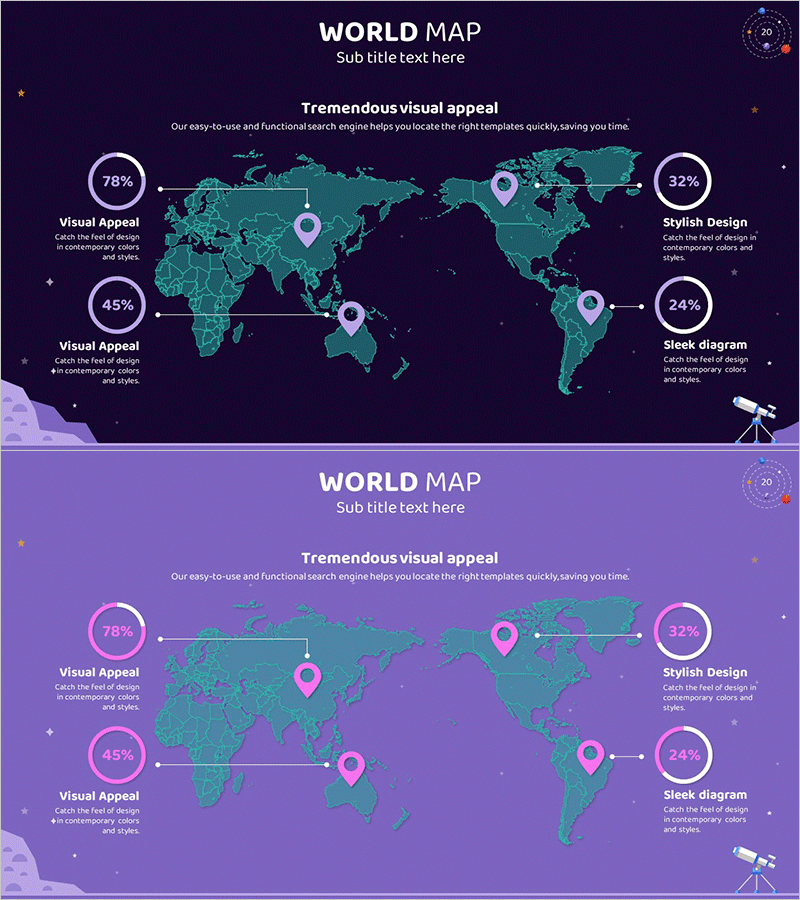
A professional PowerPoint slide combining a world map with four donut charts positioned at key global regions to visualize international data distribution. The design features a dark navy background with teal-colored continents and pink-purple circular charts that clearly display regional proportions at a glance. Ideal for space industry analysis, market share comparisons, and competitive landscape presentations in global business contexts. The 2-slide set offers multiple color variations, optimized for 16:9 widescreen format and ready for immediate use in investor pitches and strategic reports.
Usage Points
-
Main Usage
Present global market data, industry statistics, or regional performance metrics using geographic visualization combined with proportional donut charts. Effectively communicates international market share, competitive positioning, or space industry progress across regions to executive audiences.
-
How to Use
Input your regional data into the four donut charts and update region labels and percentage values. The world map background remains fixed while chart colors and text are fully editable to match corporate branding. Choose from two color variations to align with presentation tone and design guidelines.
-
Recommended For
Global business strategy presentations, international market analysis reports, space industry or technology sector competitive analysis, regional revenue or market share discussions, investor relations materials, and cross-border expansion strategy briefings.
-
Slide Structure
Central world map with four donut charts positioned at major regions (North America, Europe, Asia, and Other). Each donut chart contains 4-5 segments in pink, purple, and teal tones, connected to map location pins. Title area at top and legend space at bottom provide clear data context and labeling.
Related Products
-

Global Target Market Analysis Map – Utilizing Visual Data
#Company Introduction #Market and Competitor Analysis #Graph
-

Country Regional Distribution Visualized by Circular Graph
#Company Introduction #Market and Competitor Analysis #Graph
-

Target Area Status Analysis Graph – Data and Insights
#Company Introduction #Market and Competitor Analysis #Graph
-

Analysis of Key Target Countries Slide - Market and Competitor Analysis
#Company Introduction #Market and Competitor Analysis #Graph
