Astronomy Analysis Detailed Graph – Visualizing the Universe through Data
RJ0700015_13
- Last Update 07/26/2025
- File Size 0.7MB
- # of Slides 2
- File Format PPTX
- Slide Ratio 16:9
- Color
Keywords
- #Content-Based Slides
- #Design-Based Slides
- #Product/Service Introduction
- #Market and Competitor Analysis
- #Graph
- #Features
- #Market Analysis
- #Column
- #Segmented Column
- #16:9
- #vertical bar chart PowerPoint
- #bar graph presentation slide
- #data comparison chart template
- #7-item chart design
- #gradient bar graph
- #astronomy analysis slide
- #numerical data visualization PowerPoint
About the Product
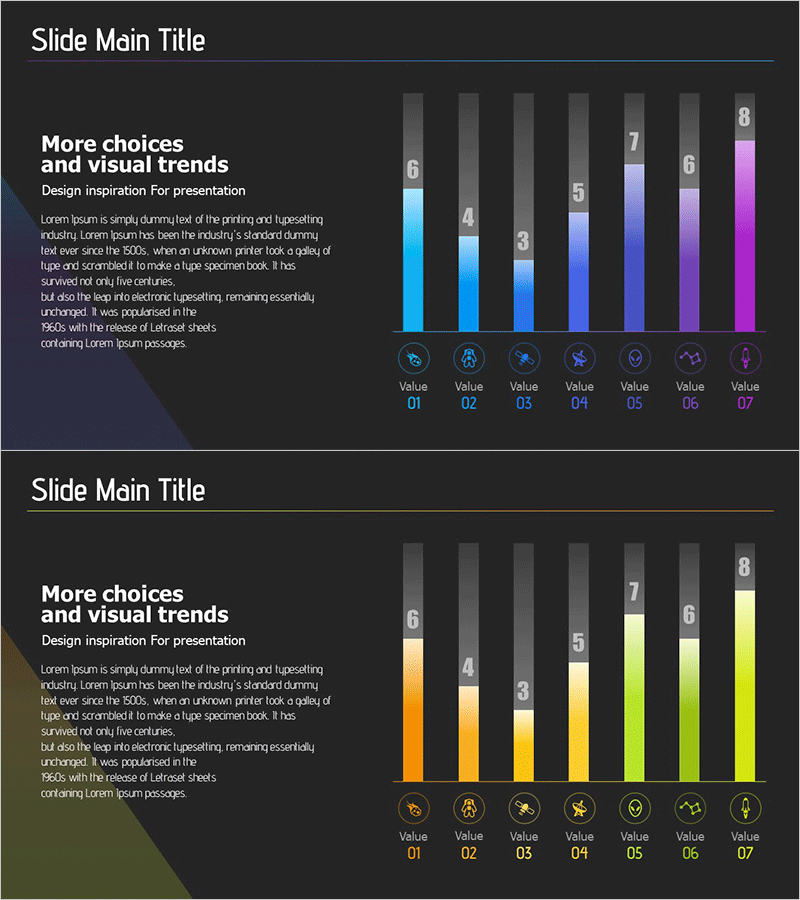
A vertical bar chart PowerPoint slide designed for astronomy data analysis and comparative visualization. This presentation template features 7 data items displayed as vertical bars with a blue-to-purple gradient that emphasizes data variations. Each bar is labeled with numerical values at the top, and the bottom section includes icons paired with Value 01 through Value 07 labels. Ideal for astronomy research presentations, market analysis reports, performance comparisons, and scientific data visualization. The 2-slide set includes color variations (blue-purple, orange-yellow, and green palettes) allowing you to match your presentation theme while maintaining consistent chart structure and readability.
Usage Points
-
Main Usage
Displays 7 data points using bar height to enable quick visual comparison of quantities, rankings, and magnitude differences. Effectively communicates quantitative information such as astronomical observations, sales figures, market share, and performance metrics in a clear, impactful manner.
-
How to Use
Place this chart in the analysis, results, or achievements section of your presentation to highlight key metrics. The bar heights and color gradient allow audiences to instantly grasp data trends, while the bottom icons and labels clearly distinguish each category. Combining with supporting text enhances persuasiveness and audience engagement.
-
Recommended For
Data analysts, marketing professionals, researchers, financial officers, consultants, and anyone presenting quantitative findings. Particularly suited for astronomy and space science presentations, market research reports, financial statements, and performance evaluation meetings.
-
Slide Structure
2-slide set featuring identical 7-item vertical bar charts in different color palettes (blue-purple and orange-yellow-green variations). Each slide layout includes a title area, left-aligned descriptive text box, right-aligned chart area, and bottom section with Value 01-07 labels paired with corresponding icons for clear data identification.
Related Products
-

Visualizing the Changing Trend of the Ageing Population with a 100% Stacked Bar Graph
#Business Strategy #Market and Competitor Analysis #Marketing Plan and Strategy
-

Medical Services Characteristics Connection Diagram
#Market and Competitor Analysis #Graph #Customer Analysis
-

Stereographic Segmentation Bar Chart – Visualization of Market Analysis and Trends
#Market and Competitor Analysis #Graph #Market Analysis
-

Orange Purple Subdivided Graph Table – Visualizing Market Data
#Market and Competitor Analysis #Diagram #Graph
