Customer Analysis by Country Slide – Market Trends and Insights
RJ0900005_13
- Last Update 08/16/2025
- File Size 1MB
- # of Slides 2
- File Format PPTX
- Slide Ratio 16:9
- Color
Keywords
About the Product
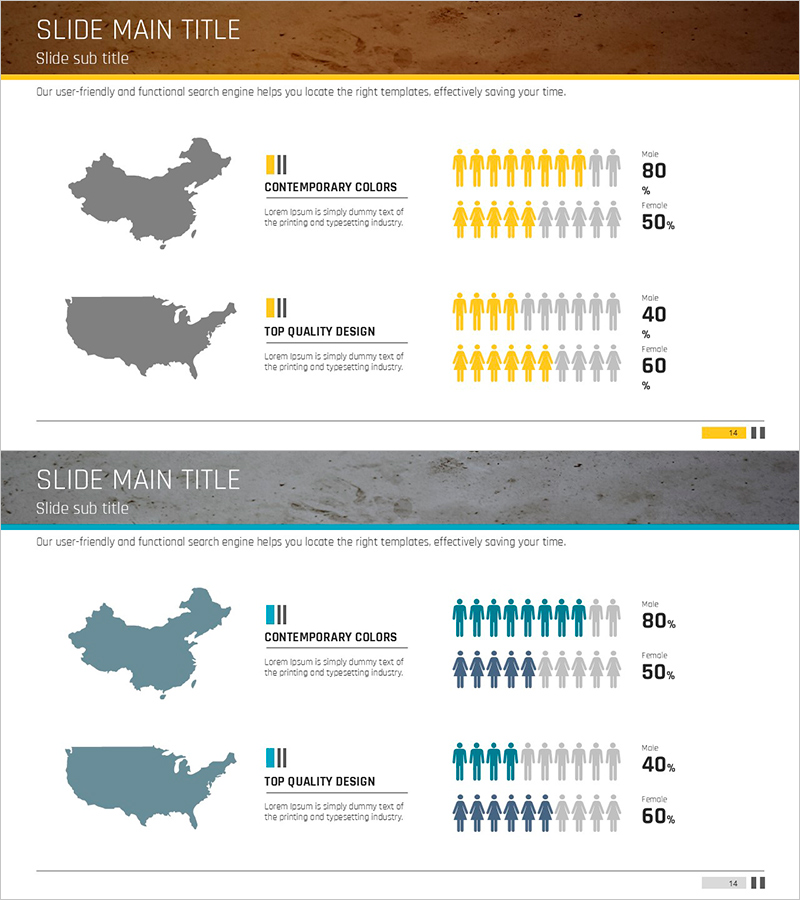
A 2-slide PowerPoint presentation that visualizes customer analysis by country and market trends. The slides feature maps of China and the United States with yellow and blue population icons arranged to show regional customer distribution at a glance. Beside each map, percentage data is displayed as bar charts, enabling quick comparison of market share and customer segmentation. With a brown header and minimalist layout, these slides are ready for immediate use in business presentations, market analysis reports, and competitive landscape assessments.
Usage Points
-
Main Usage
Visualize customer distribution and market share by country and region using map-based graphics to clearly communicate market conditions to executives and investors. Serves as a tool for target market analysis, customer segmentation, and competitive benchmarking with data-driven decision support.
-
How to Use
Insert into the market analysis section of business plans, investor pitch decks, or marketing strategy documents to explain regional customer distribution. Replace country names on the maps and update population icon counts and percentage data with actual figures for immediate presentation use.
-
Recommended For
Marketing managers, business development teams, executives preparing reports, and investor relations professionals explaining market analysis and customer distribution. Particularly valuable for global business, e-commerce, financial services, and consulting firms presenting strategic initiatives.
-
Slide Structure
Two-slide format with each slide containing one map, one title area, two population icon comparison zones, and two percentage data display areas. Organized with four text input fields and four data visualization zones optimized for country-level comparative analysis.
Related Products
-

Global Customer Market Analysis Slide – Market and Competitor Analysis
#Market and Competitor Analysis #Graph #Other
-

Data Visualization Slide Template Featuring World Map
#Market and Competitor Analysis #Graph #Other
-

Analysis of the Gender Ratio of Users in the US Market – A Blend of Teal and Gray
#Market and Competitor Analysis #Graph #Other
-

Premium Management Presentation Map Analysis3 - Customer Insights and Market Analysis
#Market and Competitor Analysis #Graph #Other
