Customer Type Analysis Slide – Focusing on Market Share
RJ0600039_10
- Last Update 07/01/2025
- File Size 2.9MB
- # of Slides 2
- File Format PPTX
- Slide Ratio 16:9
- Color
Keywords
- #Content-Based Slides
- #Design-Based Slides
- #Market and Competitor Analysis
- #Graph
- #Other
- #Customer Analysis
- #Market Share
- #16:9
- #customer type analysis PowerPoint slide
- #market share comparison infographic
- #customer segmentation presentation
- #marketing analysis slide
- #how to visualize customer demographics in PowerPoint
About the Product
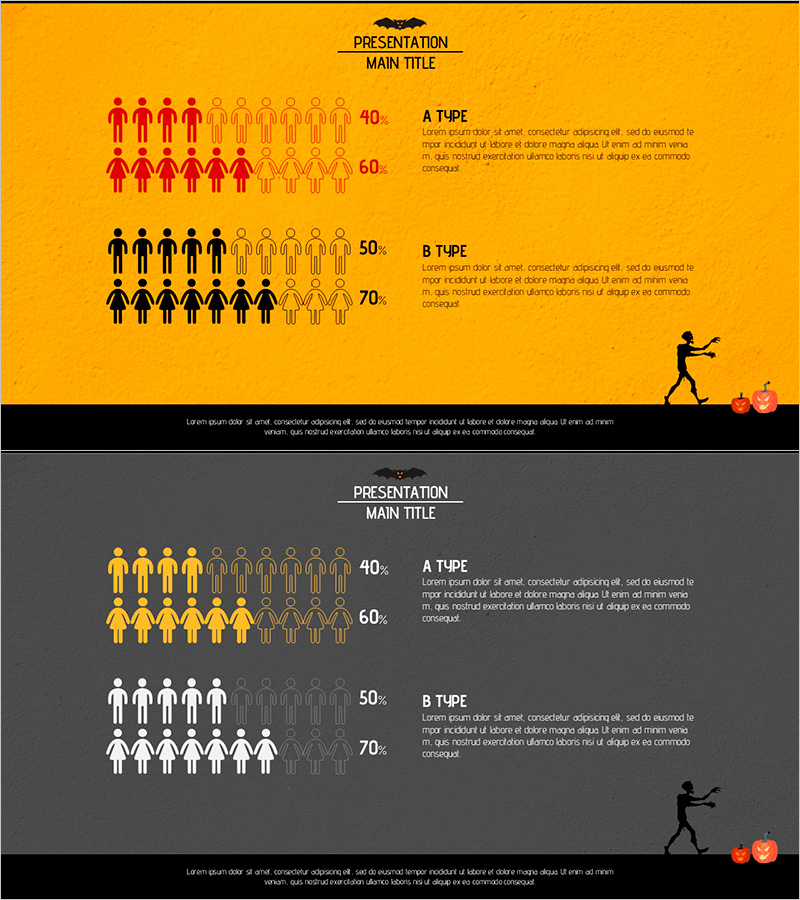
A PowerPoint slide designed for market share analysis and customer type comparison. This presentation slide features two design versions with orange and gray backgrounds, visualizing Type A and Type B customers using male and female icons. Each customer segment displays specific percentage data (40%, 60%, 50%, 70%) highlighted in distinct colors (red, black, yellow, white) to enhance readability. The slide includes ample text description areas, making it immediately applicable for marketing strategy presentations, market analysis reports, and customer segmentation discussions. Perfect for business proposals and investor pitches requiring clear customer demographic visualization.
Usage Points
-
Main Usage
This slide enables quick comparison of market share analysis and customer type distribution data. By representing Type A and Type B customer gender composition through icon-based infographics, it provides visual evidence for marketing strategy decisions and customer structure analysis.
-
How to Use
Use this slide in marketing plans, market analysis reports, customer segmentation presentations, and business plan market analysis sections. The orange version suits warm-toned presentations, while the gray version works best for professional corporate settings and formal investor meetings.
-
Recommended For
Marketing managers, sales strategists, market analysts, and business development teams presenting customer structure analysis to executives, investors, and partners. Particularly valuable in B2B proposals and investor relations materials for demonstrating target customer segment analysis.
-
Slide Structure
The slide layout includes a title area at the top, left-aligned icon groups (10 male and female icons arranged in rows), centered percentage figures (40%, 60%, 50%, 70%), and right-aligned text description area. Both slides maintain identical layouts with only background colors differentiated (orange and gray) to create visual contrast.
Related Products
-

Drug Addiction Gender Ratio Analysis Graph - Customer Analysis
#Market and Competitor Analysis #Graph #Other
-

Camera Pie Chart – Market Share Analysis
#Market and Competitor Analysis #Graph #Other
-

Customer Analysis Donut Chart - Visualizing Market Share
#Market and Competitor Analysis #Graph #Other
-

Horizontal Bar Charts for Customer Analysis – Summer Vacation Template
#Market and Competitor Analysis #Graph #Other
