Sex Ratio Graph for Market and Customer Analysis Visualization
RJ0900011_17
- Last Update 08/19/2025
- File Size 1.4MB
- # of Slides 2
- File Format PPTX
- Slide Ratio 16:9
- Color
Keywords
About the Product
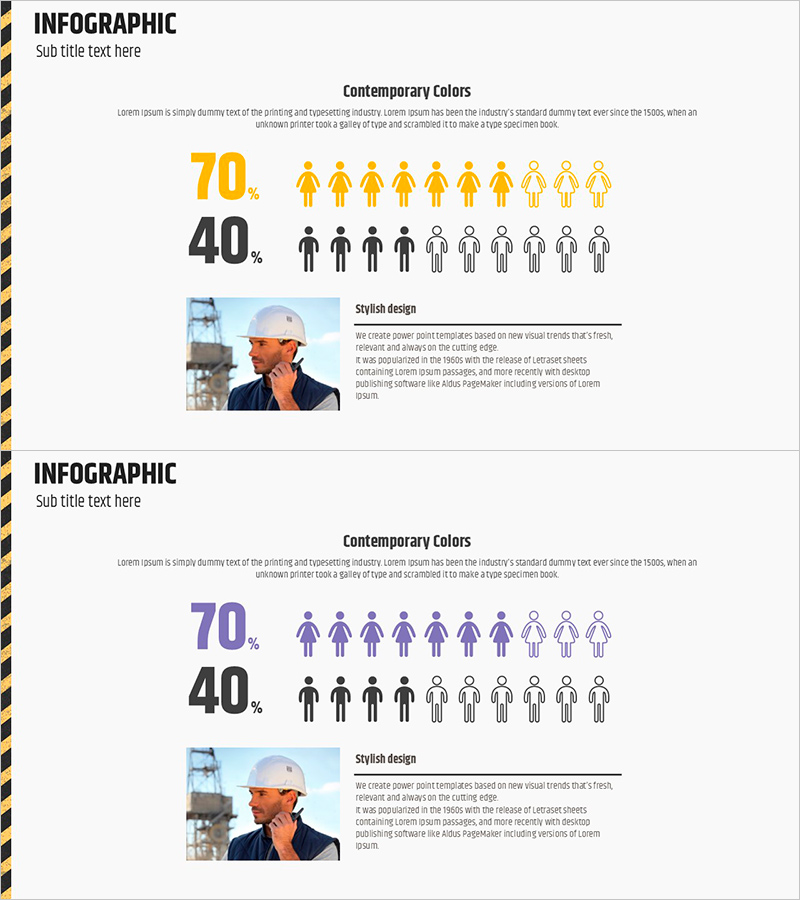
A PowerPoint slide for market and customer analysis featuring a gender ratio graph visualization. The 2-slide deck uses a yellow and black dual-tone background to display female 70% and male 40% proportions through icon-based infographics. Each slide maintains consistent layout for clear data comparison, with dedicated text description areas and image spaces. Instantly applicable to presentations requiring quantitative data visualization such as customer segmentation, market overview analysis, and competitive benchmarking.
Usage Points
-
Main Usage
Visualizes gender ratio data in market and customer analysis with intuitive icon representation. The contrast between filled and transparent icons clearly expresses proportions, supporting data-driven decision-making in business presentations.
-
How to Use
Use in the market analysis section of investor pitch decks, business plans, or marketing proposals to explain customer composition ratios. Edit text areas with analysis content and customize colors and figures as needed for your presentation.
-
Recommended For
Recommended for marketing managers, business planners, and investor relations professionals presenting customer segmentation and market overview. Particularly suitable for gender-based target analysis, customer profile analysis, and market share comparison presentations.
-
Slide Structure
2-slide format with each slide divided into left image area (approximately 30%) and right text description area (approximately 70%). Title at top, gender ratio icons (10-unit scale) in center, and descriptive text at bottom create a clear information hierarchy.
Related Products
-

Participation Rate and Exercise Schedule – Efficient Operations Plan
#Operational Plan #Market and Competitor Analysis #Diagram
-

Customer Analysis Donut Chart - Visualizing Market Share
#Market and Competitor Analysis #Graph #Other
-

Analysis of the Gender Ratio of Users in the US Market – A Blend of Teal and Gray
#Market and Competitor Analysis #Graph #Other
-

User Gender Ratio Analysis Graph – Essential Tool for Market and Customer Analysis
#Market and Competitor Analysis #Graph #Other
