Furniture Sales Performance Graph – Business Strategy Achievement
RJ0900023_9
- Last Update 08/23/2025
- File Size 1.7MB
- # of Slides 2
- File Format PPTX
- Slide Ratio 16:9
- Color
Keywords
- #Content-Based Slides
- #Design-Based Slides
- #Business Strategy
- #Financial Plans and Performance
- #Graph
- #Achievements
- #Sales and Revenue
- #Horizontal Bar
- #Horizontal Bar Chart
- #16:9
- #horizontal bar chart PowerPoint
- #sales performance slide template
- #4-item comparison graph
- #furniture sales data visualization
- #business performance chart PPT
About the Product
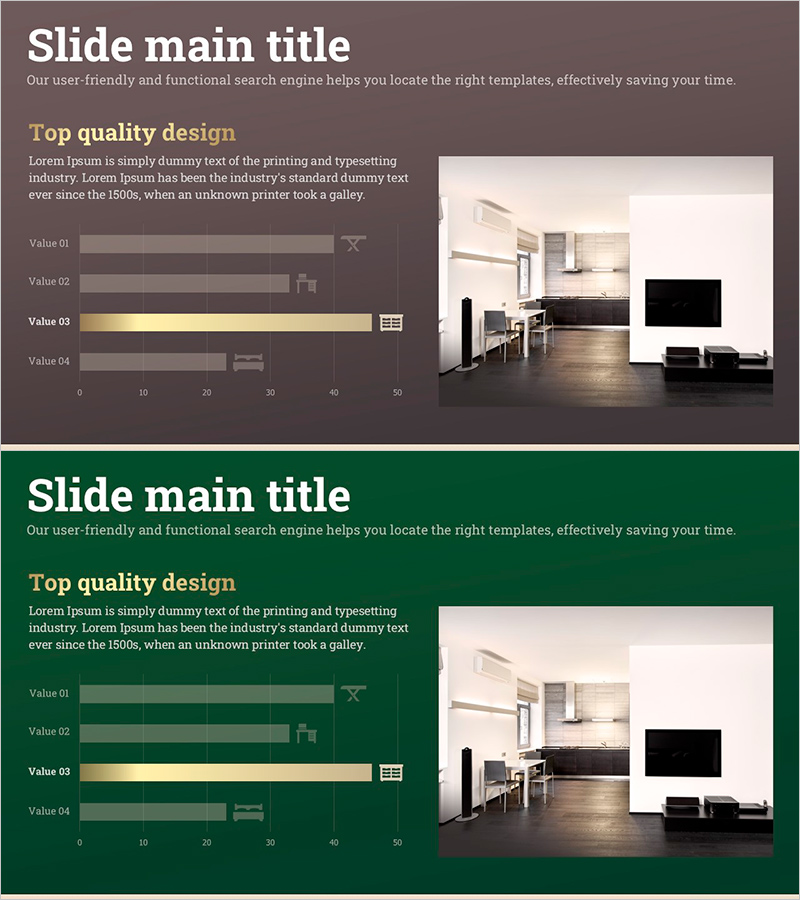
A horizontal bar chart PowerPoint slide visualizing furniture sales performance across four items. Featuring a brown background with beige accent colors, this data comparison slide presents numerical values intuitively. The 2-slide deck in 16:9 aspect ratio is ready for immediate use in business presentations, financial reports, sales updates, and performance reviews. Bar lengths enable clear numerical comparison, while right-side icons reinforce each item's meaning and context.
Usage Points
-
Main Usage
Visualizes and compares four data items—such as sales figures, departmental performance, or product revenue—using horizontal bars. Bar length directly represents numerical magnitude, enabling instant visual comparison. Right-side icons enhance each item's meaning and context.
-
How to Use
Ideal for business performance reports, quarterly and annual sales presentations, product-line revenue comparisons, and departmental performance analysis. The brown color scheme maintains corporate professionalism while emphasizing data credibility and financial reliability.
-
Recommended For
Finance teams, sales departments, executives preparing performance reports, business analysts, marketing and planning professionals requiring sales data visualization. Applicable across furniture, retail, manufacturing, distribution, and any industry needing sales comparison presentations.
-
Slide Structure
2-slide deck. First slide: brown background with 4 horizontal bar chart items (Value 01–04) and interior design image on the right. Second slide: identical layout in green tone, offering color variation for presentation flexibility and visual interest.
Related Products
-

Popular Snack Graph for Revenue Visualization – Simplicity and Intuition
#Business Strategy #Financial Plans and Performance #Graph
-

Revenue Breakthrough: Achieving All-Time Highs with Bar Graphs
#Business Strategy #Financial Plans and Performance #Graph
-

Results of Preference Survey by Beer Product – Utilizing Horizontal Bar Graph
#Business Strategy #Financial Plans and Performance #Graph
-

Striking Performance Gap in Agricultural Outcomes
#Business Strategy #Financial Plans and Performance #Graph
