Striking Performance Gap in Agricultural Outcomes
RB0500004_4
- Last Update 03/13/2025
- File Size 5.7MB
- # of Slides 2
- File Format PPTX
- Slide Ratio 4:3
- Color
Keywords
- #Content-Based Slides
- #Design-Based Slides
- #Business Strategy
- #Financial Plans and Performance
- #Graph
- #Achievements
- #Sales and Revenue
- #Horizontal Bar
- #Horizontal Bar Chart
- #4:3
- #horizontal bar chart PowerPoint
- #bar graph slide template
- #comparative analysis chart
- #agricultural performance presentation
- #data comparison diagram PowerPoint
About the Product
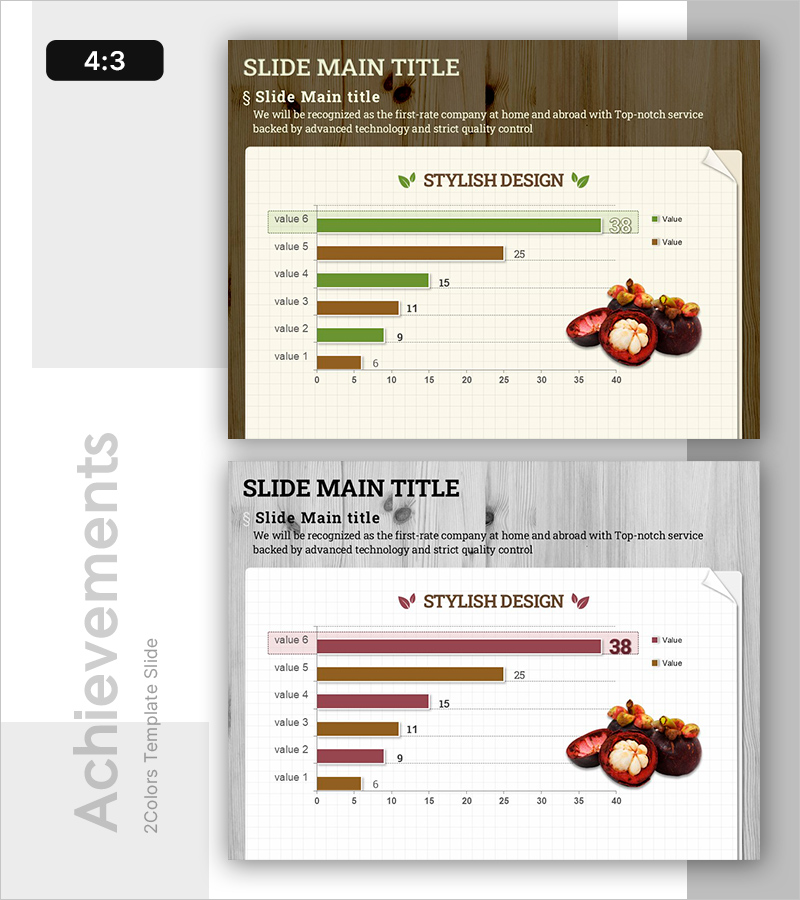
A horizontal bar chart PowerPoint slide designed for agricultural performance analysis and comparative data visualization. The slide presents six data items in green and brown color schemes, with actual produce imagery positioned on the right to reinforce presentation context. The wood-textured background and cream-colored card layout create a natural, professional atmosphere, while gridlines and value labels ensure clear data readability. Two slide variations provide color flexibility—green & brown versus brown & wine red—allowing you to match your presentation theme. Ideal for financial reports, performance analysis, comparative data presentations, and business outcome reviews. Fully editable PPTX format with 2 slides in 4:3 aspect ratio.
Usage Points
-
Main Usage
Optimized for comparing multiple data items side-by-side and visualizing rankings in horizontal orientation. Effectively displays quantitative data such as agricultural yields, sales figures, production volumes, and market share. Gridlines and numeric labels support precise value interpretation.
-
How to Use
Replace the six item labels and values with your own data. Select the color scheme (green & brown or brown & wine red) that matches your presentation branding. Substitute the produce image area with relevant photography to enhance visual consistency and reinforce your message.
-
Recommended For
Ideal for agricultural and food industry reports, sales performance presentations, market analysis materials, financial planning decks, and business outcome evaluation meetings. Recommended for marketing teams, sales departments, and executive-level reporting.
-
Slide Structure
2-slide set. Each slide features a title area, six horizontal bars in dual-color series (green & brown or brown & wine red), horizontal axis ranging 0–40, numeric value labels (6, 9, 11, 15, 25, 38), and a produce image area on the right. 4:3 aspect ratio, fully editable PPTX format.
Related Products
-

Revenue Breakthrough: Achieving All-Time Highs with Bar Graphs
#Business Strategy #Financial Plans and Performance #Graph
-

Results of Preference Survey by Beer Product – Utilizing Horizontal Bar Graph
#Business Strategy #Financial Plans and Performance #Graph
-

Popular Snack Graph for Revenue Visualization – Simplicity and Intuition
#Business Strategy #Financial Plans and Performance #Graph
-

Furniture Sales Performance Graph – Business Strategy Achievement
#Business Strategy #Financial Plans and Performance #Graph
