Revenue Breakthrough: Achieving All-Time Highs with Bar Graphs
RB0800043_3
- Last Update 03/25/2025
- File Size 0.8MB
- # of Slides 2
- File Format PPTX
- Slide Ratio 4:3
- Color
Keywords
- #Content-Based Slides
- #Design-Based Slides
- #Business Strategy
- #Financial Plans and Performance
- #Graph
- #Achievements
- #Sales and Revenue
- #Horizontal Bar
- #Horizontal Bar Chart
- #4:3
- #horizontal bar chart PowerPoint
- #bar graph slide template
- #data comparison chart
- #revenue performance PPT
- #business metrics slide
About the Product
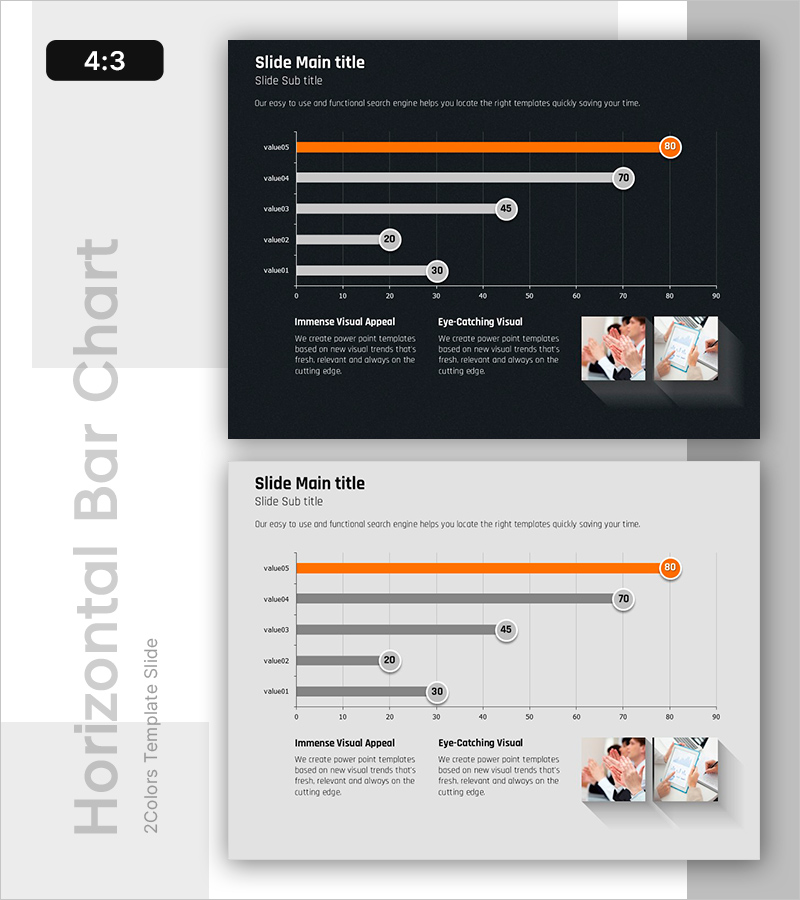
A PowerPoint slide featuring five data items displayed as horizontal bars for easy numerical comparison. Built on a dark navy background with orange accent bars and white typography, this chart template clearly communicates sales figures, performance metrics, and business results. Each bar is labeled with a circular badge showing the corresponding value, enabling quick comparative analysis. This ready-to-edit PPT slide template works seamlessly in business presentations, financial reports, and performance dashboards.
Usage Points
-
Main Usage
Compares five data points—such as sales figures, revenue streams, or performance indicators—using horizontal bars. The layout makes relative differences immediately apparent, helping audiences grasp comparative metrics at a glance.
-
How to Use
Ideal for quarterly earnings presentations, departmental performance reviews, competitive benchmarking, and business outcome reports. The dark background ensures excellent readability in projector environments, while the orange accent bar draws attention to key figures and top performers.
-
Recommended For
Finance teams, sales departments, executive briefings, quarterly business reviews, investor presentations, and performance analysis meetings. Perfect for highlighting revenue breakthroughs and achievement milestones in corporate communications.
-
Slide Structure
Dark navy background with five horizontal bars arranged vertically (value01 through value05). The top bar (value05) is highlighted in orange, while others appear in gray. Circular value badges (30, 20, 45, 70, 80) are positioned on the right. Lower left section includes descriptive text blocks for 'Immense Visual Appeal' and 'Eye-Catching Visual' messaging.
Related Products
-

Results of Preference Survey by Beer Product – Utilizing Horizontal Bar Graph
#Business Strategy #Financial Plans and Performance #Graph
-

Furniture Sales Performance Graph – Business Strategy Achievement
#Business Strategy #Financial Plans and Performance #Graph
-

Popular Snack Graph for Revenue Visualization – Simplicity and Intuition
#Business Strategy #Financial Plans and Performance #Graph
-

Striking Performance Gap in Agricultural Outcomes
#Business Strategy #Financial Plans and Performance #Graph
