Sensuous Cloud Presentation Template Pie Chart1 – Visualizing Market Share
RJ0200040_6
- Last Update 04/09/2025
- File Size 3.7MB
- # of Slides 2
- File Format PPTX
- Slide Ratio 16:9
- Color
Keywords
About the Product
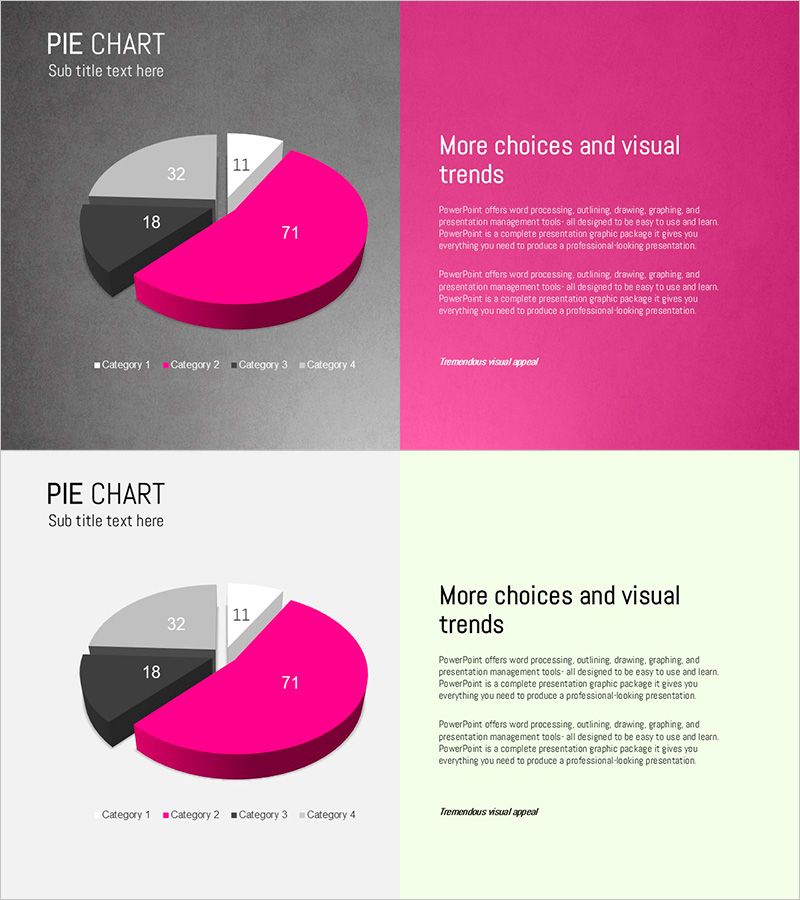
A PowerPoint pie chart slide visualizing the proportion of four categories with magenta accent highlighting the primary segment. The contrast between magenta, gray, black, and white creates clear data hierarchy and visual impact. Two layout variations—3D perspective and flat design—are provided for immediate use in market analysis, performance reporting, and competitive comparison presentations. The right side features a dedicated text area for adding insights and interpretations, while the 16:9 widescreen format ensures compatibility with modern presentation environments.
Usage Points
-
Main Usage
Designed to communicate the proportional relationship of four data categories—market share, sales distribution, customer composition, or budget allocation—at a glance. The magenta accent draws attention to the most critical data point, while contrast with other segments establishes clear information hierarchy.
-
How to Use
Use in executive reports, quarterly performance presentations, market analysis briefings, and investor pitch decks to explain ratio-based data intuitively. Add category-specific insights and strategic implications in the right-side text area to complete your data storytelling.
-
Recommended For
Marketing managers, financial analysts, business strategists, and sales executives presenting regular reports, strategy meetings, or client proposals. Particularly effective for competitive benchmarking, market segmentation analysis, and portfolio composition discussions.
-
Slide Structure
Both slides follow identical structure with a 4-segment pie chart on the left (displaying 71%, 32%, 18%, 11% proportions) and a title-plus-description text area on the right. Slide 1 features a 3D perspective pie chart while Slide 2 offers a flat design version, allowing selection based on presentation tone and audience preference.
Related Products
-

Red-Blue Stereoscopic Pie Charts – Performance Visualization
#Company Introduction #Market and Competitor Analysis #Diagram
-

Orange Hexagon Pie Chart Template – Market Share Analysis
#Company Introduction #Market and Competitor Analysis #Graph
-

Three Key Performance Pie Charts – Visualization of Performance Analysis
#Company Introduction #Market and Competitor Analysis #Graph
-

Pie Chart for Beer Market Share - Ideal for Market Analysis
#Company Introduction #Market and Competitor Analysis #Graph
