Orange Hexagon Pie Chart Template – Market Share Analysis
RJ0200038_7
- Last Update 04/09/2025
- File Size 0.8MB
- # of Slides 2
- File Format PPTX
- Slide Ratio 16:9
- Color
Keywords
- #Content-Based Slides
- #Design-Based Slides
- #Company Introduction
- #Market and Competitor Analysis
- #Graph
- #Key Achievements
- #Market Share
- #Circles
- #Pie Chart
- #16:9
- #pie chart PowerPoint slide
- #donut chart template
- #market share analysis slide
- #3-segment pie chart
- #ratio comparison PowerPoint
- #data visualization slide template
About the Product
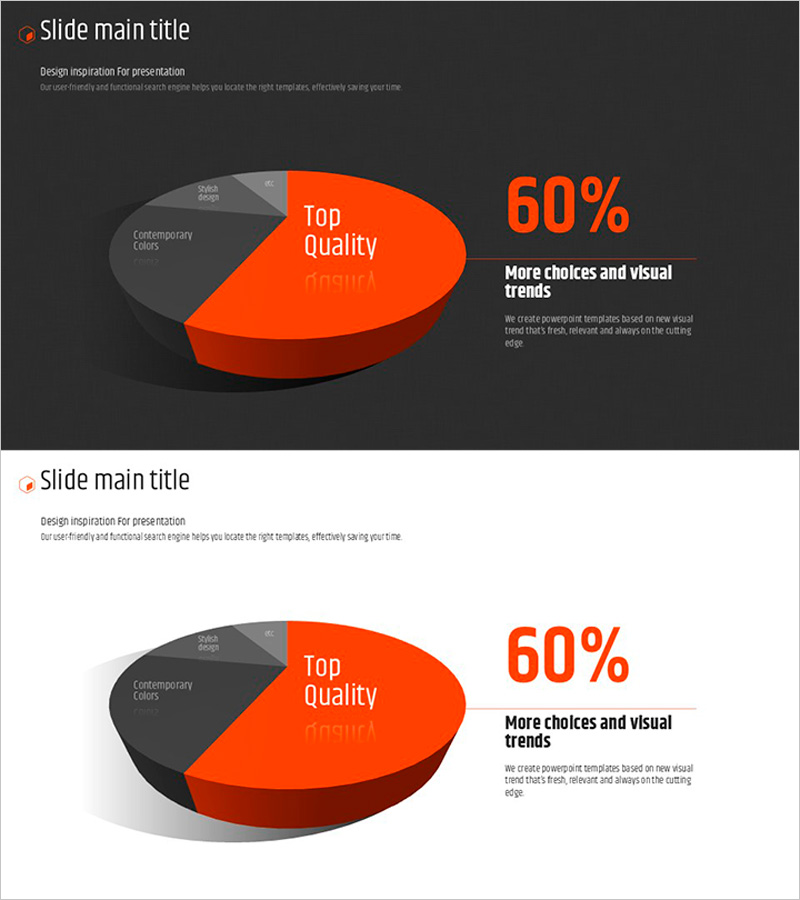
A visually striking 3-segment pie chart PowerPoint slide featuring a bright orange color palette and 3D donut-style design. The dark background creates strong contrast, making data stand out clearly for market share analysis, performance metrics, and ratio comparisons. The left side displays category labels in a legend format, while the right side emphasizes key figures (60%) with supporting text. This 2-slide template includes both dark and light theme variations, allowing you to choose the best fit for your presentation environment. Fully editable PPTX format enables quick data input and color customization to match your brand identity.
Usage Points
-
Main Usage
Ideal for visualizing market share, sales ratios, customer demographics, budget allocation, and other part-to-whole relationships. The 3D donut-style pie chart clearly shows relative data sizes while allowing you to highlight key segments and draw audience attention to critical insights.
-
How to Use
Perfect for business presentations, marketing reports, financial analysis, and strategy meetings where you need to explain compositional percentages. Simply replace the legend labels and percentages with your own data, adjust colors to match your corporate branding, and customize text as needed.
-
Recommended For
Marketing professionals, financial analysts, executives, consultants, and sales teams presenting data-driven insights. Particularly effective for quarterly performance reviews, customer segmentation analysis, market research presentations, and budget breakdowns.
-
Slide Structure
2-slide template featuring both dark theme (charcoal background) and light theme (white background) versions. Each slide layout includes a left-side legend with 3 category labels, a center 3D donut-style pie chart, and a right-side section highlighting key metrics (60%) with descriptive text area.
Related Products
-

Pie Chart of Composition Ratio by Fashion Type – The Start of Data Visualization
#Company Introduction #Market and Competitor Analysis #Diagram
-

Red-Blue Stereoscopic Pie Charts – Performance Visualization
#Company Introduction #Market and Competitor Analysis #Diagram
-

Pie Chart for Beer Market Share - Ideal for Market Analysis
#Company Introduction #Market and Competitor Analysis #Graph
-

Three Key Performance Pie Charts – Visualization of Performance Analysis
#Company Introduction #Market and Competitor Analysis #Graph
