Visualization of Game Match Result Score – Emphasizing Competitive Advantage
RJ0600037_34
- Last Update 06/30/2025
- File Size 0.3MB
- # of Slides 2
- File Format PPTX
- Slide Ratio 16:9
- Color
Keywords
- #Content-Based Slides
- #Design-Based Slides
- #Market and Competitor Analysis
- #Diagram
- #Text Box
- #Competitor Analysis
- #Competitive Advantage
- #Cluster
- #Closed Cluster Diagram
- #Rectangle Text Box
- #16:9
- #game score diagram PowerPoint
- #competitive analysis slide template
- #comparison visualization PPT
- #score comparison diagram
- #market analysis presentation slide
About the Product
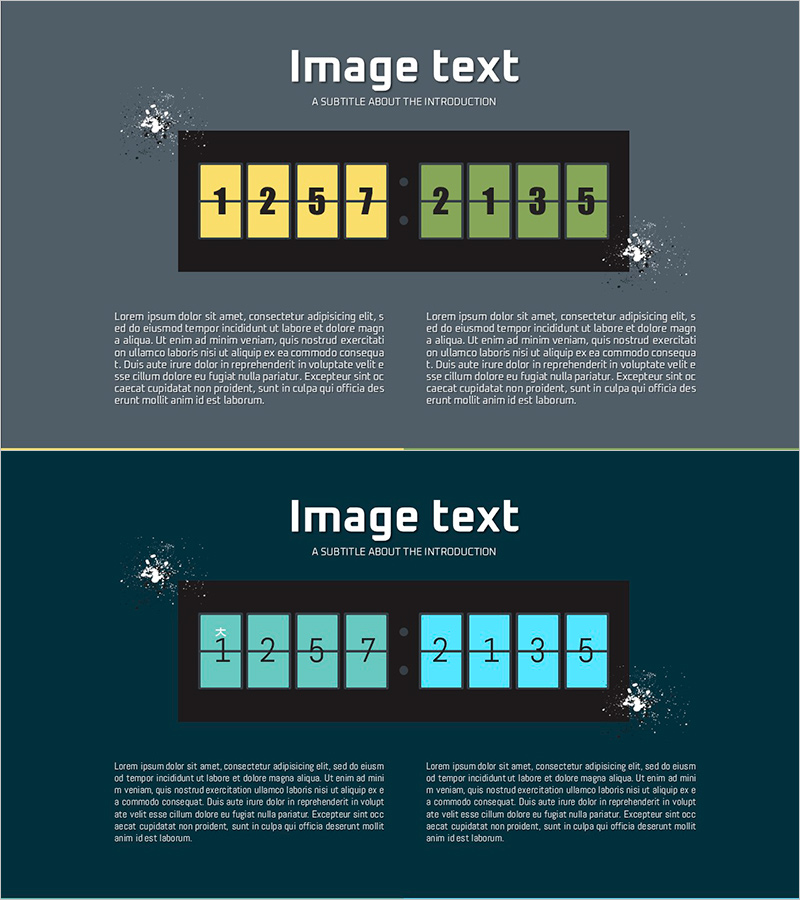
A PowerPoint slide template that visualizes game match results and competitive advantage through an 8-cell comparison diagram. Two teams' scores are displayed side-by-side in contrasting colors—yellow and green on the first slide, cyan and light blue on the second—against a dark background for maximum clarity. Ideal for competitive analysis presentations, market comparison reports, and performance benchmarking. Each cell accepts numeric input for instant customization, making it perfect for sales pitches, investor presentations, and strategic planning documents. The two-slide set provides flexible color options to match your brand identity while maintaining visual impact and data readability.
Usage Points
-
Main Usage
Visually compare two teams' or products' scores, performance metrics, and competitive capabilities side-by-side. Suitable for game result analysis, competitor benchmarking, market share comparison, performance evaluation, and any presentation requiring direct numerical comparison.
-
How to Use
Enter numeric values in each cell to display team scores. Choose between yellow-green or cyan-light blue color schemes to match your brand. Insert into competitive analysis slides, performance reports, marketing strategy presentations, or market analysis sections to make data differences immediately apparent to your audience.
-
Recommended For
Executive presentations on competitive positioning, marketing team performance reports, investor pitch decks with market analysis, product comparison presentations, sports and gaming industry performance analysis, sales team competitive intelligence briefings.
-
Slide Structure
Two-slide set with dark background. Each slide features one 8-cell comparison diagram: first slide uses yellow (left 4 cells) and green (right 4 cells); second slide uses cyan and light blue. Symmetrical left-right layout clearly represents competitive dynamics. All cells support numeric input for easy customization.
Related Products
-

Card Competitor Comparison Slide Template – Competitive Advantage Analysis
#Market and Competitor Analysis #Diagram #Competitor Analysis
-

Service Analysis Line Graph – Visualization of Competitive Advantage
#Market and Competitor Analysis #Diagram #Graph
-

Blue Green Graph Numerical Change Analysis – Ideal for Market and Competitive Analysis Presentation
#Market and Competitor Analysis #Diagram #Graph
-

Business Program Analysis Area Graph – Competitive Edge
#Market and Competitor Analysis #Diagram #Graph
