Characteristics of Seasonal Forests – Market and Competitor Analysis
RJ0600091_20
- Last Update 07/15/2025
- File Size 3.6MB
- # of Slides 2
- File Format PPTX
- Slide Ratio 16:9
- Color
Keywords
- #Content-Based Slides
- #Design-Based Slides
- #Market and Competitor Analysis
- #Diagram
- #Text Box
- #Competitor Analysis
- #Market Analysis
- #Cluster
- #Closed Cluster Diagram
- #Rectangle Text Box
- #16:9
- #two-column text box PowerPoint
- #comparison analysis slide template
- #market analysis presentation
- #competitive analysis PowerPoint
- #text box slide design
- #how to create comparison slides in PowerPoint
About the Product
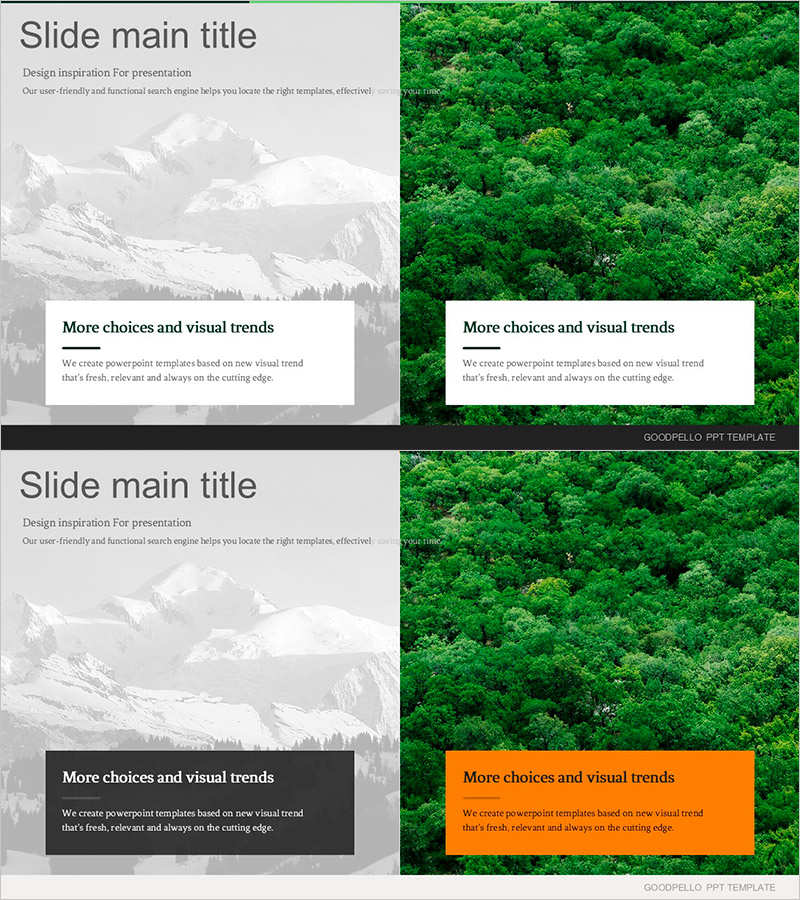
A two-column text box PowerPoint slide designed for forest ecosystem and market competitive analysis presentations. This 2-slide deck features a striking contrast between grayscale forest imagery on the left and vibrant green forest background on the right, with white text boxes positioned on each side for information comparison and analytical discussion. Delivered in 16:9 widescreen PPTX format, fully editable and ready to customize. Perfect for market analysis, competitor comparison, seasonal characteristics explanation, and strategic business presentations. Simply edit the text box titles and body content to present your data and key messages effectively.
Usage Points
-
Main Usage
Leverage the left-right contrast structure for market analysis, competitor comparison, and seasonal characteristic presentation. Input titles and descriptive text into the white text boxes on each slide to simultaneously convey information contrast and strategic insights.
-
How to Use
Edit text box content directly by clicking on each text box within the slide, or modify via the slide master. Background images are fixed; adjust color themes as needed to align with your corporate branding and visual identity standards.
-
Recommended For
Marketing and strategy department market analysis presentations, executive reports, industry analysis seminars, competitive strategy planning meetings. Ideal for any business presentation requiring side-by-side comparison and contrast structures.
-
Slide Structure
2-slide set with white rectangular text boxes (left and right) on each slide. Left side features grayscale forest background; right side displays vibrant green forest background for visual contrast emphasis. Text box dimensions and positioning are fixed to maintain consistent layout throughout the presentation.
Related Products
-

Competitor Analysis Broken Line Graph – Visualizing Market Trends
#Market and Competitor Analysis #Diagram #Graph
-

Vertical Bar Graph & Folder Diagram – Market and Competitor Analysis
#Market and Competitor Analysis #Diagram #Graph
-

Mobile SNS Market Analysis Graph – Visualizing Competitor Analysis Data
#Market and Competitor Analysis #Diagram #Graph
-

Market Analysis Graph Ahead of the Future – Innovative Business Insights
#Market and Competitor Analysis #Diagram #Graph
