Competition and Cooperation Donut Charts
RJ0500040_21
- Last Update 06/18/2025
- File Size 0.4MB
- # of Slides 2
- File Format PPTX
- Slide Ratio 16:9
- Color
Keywords
About the Product
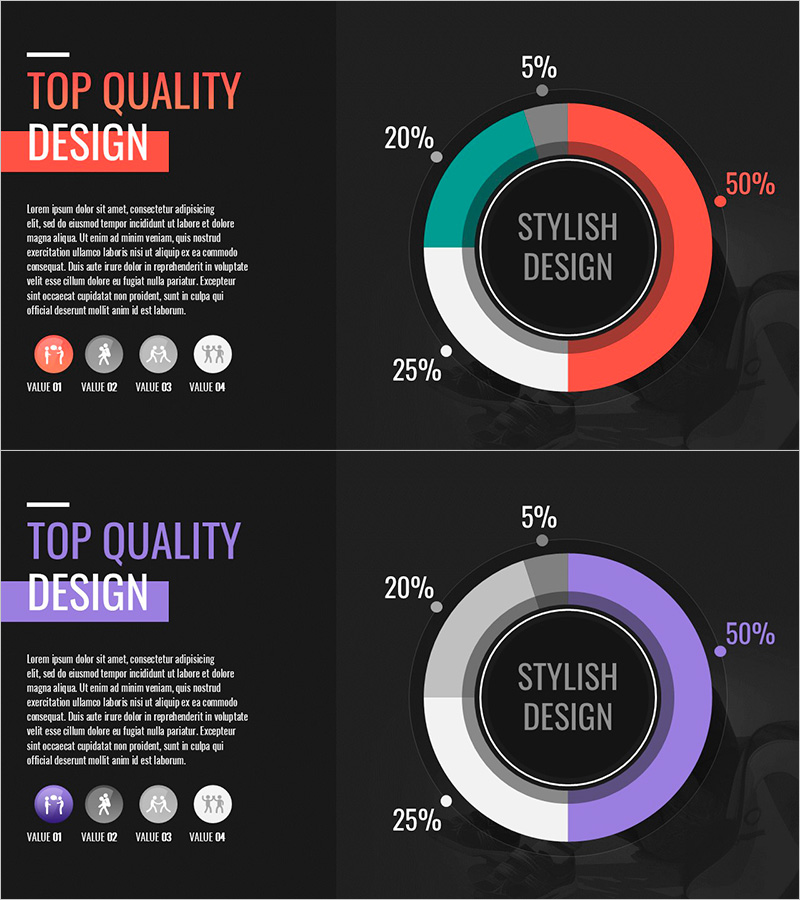
A 2-slide PowerPoint template visualizing competition and cooperation dynamics using donut charts. Set against a dark background with coral, teal, white, and gray segments, this pie chart design intuitively represents market share, competitive intensity, and collaboration levels. Each slide features a centered circular area with 'Stylish Design' text for message emphasis, paired with a left-side text block and four value icons for structured information layout. Delivered in 16:9 widescreen PPTX format, fully editable and ready for business presentations, market analysis reports, and strategic planning decks.
Usage Points
-
Main Usage
Visualize market competition structures, partnership relationships, and share distribution through circular chart design to communicate data-driven insights clearly to executives, investors, and team members. The centered circular area emphasizes key messages while four color-coded segments distinguish categories, simplifying complex information.
-
How to Use
Two slides provided with different color themes—coral-dominant and purple-dominant—allowing flexible presentation of identical content across multiple contexts. Edit donut chart values and labels to input actual data, then populate the left text area with analysis findings, interpretations, and action items to complete the presentation.
-
Recommended For
Business strategists, marketing teams, market analysts, management consultants, and investment professionals presenting competitive positioning, market share comparisons, partnership structures, customer segmentation, or product portfolio ratios. Ideal for C-suite presentations, board meetings, and strategic planning sessions.
-
Slide Structure
2-slide set. Each slide features a dark background with a 4-segment donut chart (center-emphasized) positioned right, and left-side layout with title, descriptive text, and four stacked value icons (VALUE 01–04). Percentage labels (5%, 20%, 25%, 50%) and data point markers around the donut perimeter provide quantitative reference.
Related Products
-

Donut Chart Slide for Furniture Preferences Survey
#Market and Competitor Analysis #Graph #Market Share
-

Market Share Global Map – Real-Time Data for Market Analysis
#Market and Competitor Analysis #Graph #Market Share
-

Red Market Share Slide – Compelling Donut Chart Design
#Market and Competitor Analysis #Graph #Market Share
-

Soccer Match Analysis Chart – Performance Analysis and Future Forecast
#Business Vision and Strategy #Market and Competitor Analysis #Graph
